About the area
Coliban Water provides water and wastewater services to about 186,000 people in 49 towns across central and northern Victoria.
Coliban Water also supplies about 1,350 rural licence holders from 500 km of open channels in the Coliban rural water supply system extending from Malmsbury to Bendigo, and to Raywood and surrounding areas.
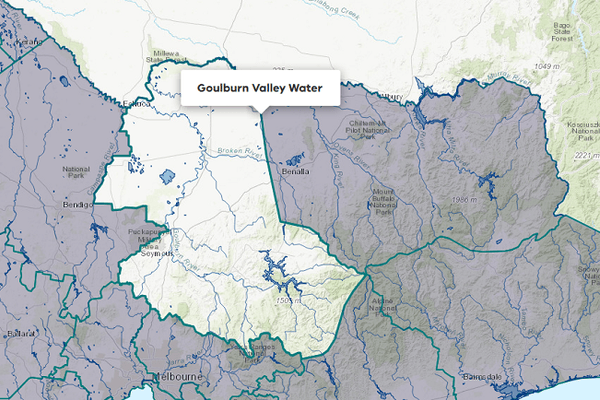
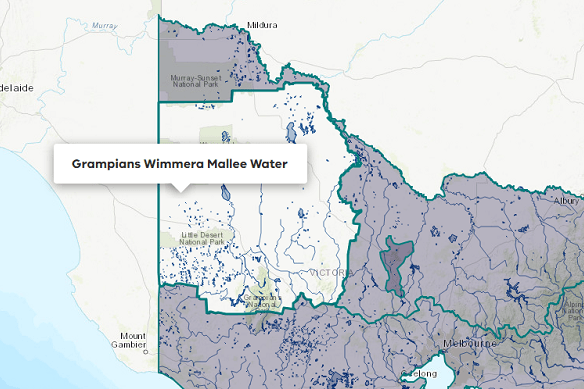
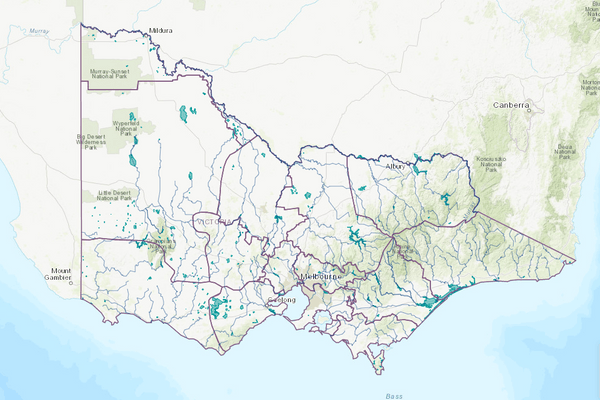
Coliban Water's service area is within parts of the Campaspe, Loddon, Murray, Goulburn and Wimmera basins. It operates two common water supply systems: the Goldfields Superpipe incorporating the Eppalock Pipeline, which it jointly operates with Central Highlands Water; and the Coliban Main Channel.
Coliban Water operates 26 urban water supply systems including 2 separate groundwater systems (Elmore and Trentham) and 9 rural subsystems.
More information on the water corporation can be found at Coliban
2022-23 overview
Urban deliveries
19,031 ML of urban residential and non-residential deliveries were made in 2022-23, similar to the previous year (20,238 ML in 2021-22).
Rural deliveries
2,265 ML of rural deliveries were made in common and rural systems in 2022-23, less than the previous year (3,104 ML in 2021-22).
Wastewater recycled at treatment plants
17% of wastewater was recycled (1,851 ML of 10,809 ML), less than the 21% recycled in 2021-22.
Water deliveries
Table 1: Urban system water balance, Coliban Water
Area / town / system | Start volume in store (ML) | Total inflows (ML) | Outflows (ML) | End volume in store (ML) | Distribution system efficiency (%) | ||||||
---|---|---|---|---|---|---|---|---|---|---|---|
Urban residential deliveries | Urban non-residential deliveries | Evaporation | Passed to other systems | System losses | Unattributed outflows | Total outflows | |||||
Bendigo system | 1,862 | 13,267 | 8,427 | 2,962 | 227 | 890 | 604 | 0 | 13,110 | 2,019 | 94% |
Boort | 0 | 174 | 82 | 27 | 0 | 0 | 65 | 0 | 174 | 0 | 63% |
Borung | 0 | 3 | 3 | 0 | 0 | 0 | 0 | 0 | 3 | 0 | 100% |
Bridgewater system | 0 | 190 | 82 | 48 | 0 | 0 | 60 | 0 | 190 | 0 | 68% |
Castlemaine system 1 | 1,121 | 1,976 | 1,167 | 785 | 143 | 0 | (230) | 0 | 1,865 | 1,232 | n/a |
Cohuna system | 0 | 667 | 262 | 206 | 0 | 0 | 199 | 0 | 667 | 0 | 70% |
Dingee 1 | 0 | 5 | 3 | 3 | 0 | 0 | (1) | 0 | 5 | 0 | n/a |
Echuca | 0 | 2,989 | 1,425 | 1,243 | 0 | 0 | 321 | 0 | 2,989 | 0 | 89% |
Elmore | 0 | 101 | 57 | 30 | 0 | 0 | 14 | 0 | 101 | 0 | 86% |
Goornong | 0 | 66 | 36 | 8 | 0 | 0 | 22 | 0 | 66 | 0 | 66% |
Gunbower | 0 | 89 | 27 | 9 | 0 | 0 | 53 | 0 | 89 | 0 | 40% |
Heathcote system | 174 | 354 | 144 | 66 | 43 | 0 | 67 | 0 | 321 | 207 | 65% |
Jarklin | 0 | 2 | 1 | 0 | 0 | 0 | 1 | 0 | 2 | 0 | 50% |
Korong Vale - Wedderburn | 0 | 222 | 76 | 24 | 0 | 0 | 122 | 0 | 222 | 0 | 45% |
Kyneton system | 0 | 1,072 | 481 | 513 | 0 | 0 | 78 | 0 | 1,072 | 0 | 93% |
Laanecoorie system | 0 | 187 | 71 | 27 | 0 | 0 | 89 | 0 | 187 | 0 | 52% |
Leitchville | 0 | 288 | 38 | 109 | 0 | 0 | 141 | 0 | 288 | 0 | 51% |
Lockington | 0 | 71 | 37 | 11 | 0 | 0 | 23 | 0 | 71 | 0 | 68% |
Macorna | 0 | 3 | 2 | 0 | 0 | 0 | 1 | 0 | 3 | 0 | 67% |
Mitiamo | 0 | 11 | 6 | 3 | 0 | 0 | 2 | 0 | 11 | 0 | 82% |
Mysia 2 | 0 | 5 | 0 | 0 | 0 | 0 | 5 | 0 | 5 | 0 | 6% |
Pyramid Hill | 0 | 104 | 46 | 32 | 0 | 0 | 26 | 0 | 104 | 0 | 75% |
Rochester 1 | 0 | 335 | 267 | 73 | 0 | 0 | (5) | 0 | 335 | 0 | n/a |
Serpentine | 0 | 45 | 13 | 2 | 0 | 0 | 30 | 0 | 45 | 0 | 33% |
Trentham | 89 | 140 | 80 | 15 | 0 | 0 | 43 | 0 | 138 | 91 | 69% |
Wychitella | 0 | 2 | 1 | 1 | 0 | 0 | 0 | 0 | 2 | 0 | 100% |
Total 2022-23 | 3,246 | 22,368 | 12,834 | 6,197 | 413 | 890 | 1,730 | 0 | 22,065 | 3,549 | |
Total 2021-22 | 3,179 | 25,741 | 13,949 | 6,289 | 437 | 1,669 | 3,334 | 0 | 25,678 | 3,246 |
Rural systems
Coliban Water operates 9 rural supply systems and sources water from the Campaspe basin.
Table 2: Rural system water balance, Coliban Water
Area / town / system 1 | Start volume in store (ML) | Total inflows (ML) | Outflows (ML) | End volume in store (ML) | Distribution system efficiency (%) | ||||
---|---|---|---|---|---|---|---|---|---|
Rural deliveries | Other deliveries | System losses | Passed to other systems | Total outflows (ML) | |||||
Ascot | 0 | 608 | 469 | 0 | 139 | 0 | 608 | 0 | 77% |
Axe Creek | 0 | 202 | 50 | 0 | 152 | 0 | 202 | 0 | 25% |
Cockatoo Hill | 0 | 338 | 157 | 0 | 181 | 0 | 338 | 0 | 46% |
Emu Valley | 0 | 464 | 225 | 0 | 239 | 0 | 464 | 0 | 48% |
Harcourt 2 | 1,000 | 600 | 382 | 0 | (112) | 0 | 270 | 1,330 | n/a |
Lockwood | 0 | 438 | 250 | 0 | 188 | 0 | 438 | 0 | 57% |
Specimen Hill | 0 | 1,101 | 296 | 0 | 367 | 438 | 1,101 | 0 | 67% |
Spring Gully | 0 | 206 | 48 | 0 | 154 | 4 | 206 | 0 | 25% |
Spring Gully Reservoir | 1,362 | 1,260 | 0 | 0 | 464 | 946 | 1,410 | 1,212 | 67% |
Total 2022-23 | 2,362 | 5,217 | 1,877 | 0 | 1,772 | 1,388 | 5,037 | 2,542 | |
Total 2021-22 | 1,931 | 7,048 | 2,625 | 0 | 2,065 | 1,927 | 6,617 | 2,362 |
Common systems
Coliban Water operates two common supply systems:
- the Goldfields Superpipe – this pipeline transfers water from the Waranga Western Channel (Goulburn basin) and from Lake Eppalock (Campaspe basin) for use in the Coliban Water supply system and to supply water to Central Highlands Water’s Ballarat system.
- the Coliban Main Channel – this channel conveys water from the Coliban storages (Upper Coliban, Lauriston and Malmsbury reservoirs) to supply rural subsystems and the Coliban North and Coliban South urban water supply systems.
Table 3: Common system water balance, Coliban Water
Area / town / system | Start volume in store (ML) | Total inflows (ML) | Outflows (ML) | End volume in store (ML) | Distribution system efficiency (%) | |||||
---|---|---|---|---|---|---|---|---|---|---|
Deliveries to rural customers | Passed to other systems | Evaporation | System losses | Unaccounted for outflow | Total outflows | |||||
Coliban Main Channel 1 | - | 18,828 | 154 | 15,575 | - | 3,099 | - | 18,828 | - | 84% |
Goldfields Superpipe 2 | - | 990 | 234 | 1,120 | - | (364) | - | 990 | - | n/a |
Total 2022-23 | 0 | 19,818 | 388 | 16,695 | 0 | 2,735 | 0 | 19,818 | 0 | |
Total 2021-22 | 0 | 24,912 | 479 | 21,966 | 0 | 2,467 | 0 | 24,912 | 0 |
Recycled water
Water recycled at wastewater treatment plants can be used to supplement water available in river basins. Table 4 lists the wastewater treatment plants managed by Coliban Water. Water discharged to the environment from treatment plants is included as an inflow to the water balance for each of the river basins.
More information can be found in How we account for water supply.
Table 4: Treated wastewater produced and recycled, Coliban Water
Wastewater treatment plant | Class of water | Inflows to plant (ML) | Recycled water end use (ML) | Total water recycled (ML) | Discharge (ML) | ||||||||||||
---|---|---|---|---|---|---|---|---|---|---|---|---|---|---|---|---|---|
Volume treated wastewater produced | Other inflow | Volume supplied to retailers | Domestic / residential | Municipal | Commercial | Industrial | Agriculture | Beneficial allocation | Within process | Total volume recycled | Total % recycled | Released to land | Ocean outfall discharge | Inland water discharge | Other outflow | ||
Axedale treatment plant | B | 5 | 0 | 0 | 0 | 5 | 0 | 0 | 0 | 0 | 0 | 5 | 100% | 0 | 0 | 0 | 0 |
Bendigo treatment plant | A,B,C | 7,030 | 0 | 0 | 0 | 110 | 0 | 299 | 50 | 0 | 0 | 458 | 6.0% | 0 | 0 | 6,571 | 0 |
Bridgewater / Inglewood treatment plant | C | 0 | 0 | 0 | 0 | 0 | 0 | 0 | 0 | 0 | 0 | 0 | 0% | 0 | 0 | 0 | 0 |
Boort treatment plant | C | 71 | 0 | 0 | 0 | 0 | 0 | 0 | 71 | 0 | 0 | 71 | 100% | 0 | 0 | 0 | 0 |
Castlemaine treatment plant | C | 1,465 | 0 | 0 | 0 | 1 | 0 | 0 | 0 | 0 | 0 | 1 | 0% | 0 | 0 | 1,464 | 0 |
Cohuna treatment plant | no reuse | 0 | 0 | 0 | 0 | 0 | 0 | 0 | 0 | 0 | 0 | 0 | 0% | 0 | 0 | 0 | 0 |
Dunolly treatment plant | C | 46 | 0 | 0 | 0 | 0 | 0 | 0 | 0 | 0 | 0 | 0 | 0% | 46 | 0 | 0 | 0 |
Echuca treatment plant | B | 798 | 0 | 0 | 0 | 0 | 0 | 0 | 798 | 0 | 0 | 798 | 100% | 0 | 0 | 0 | 0 |
Elmore treatment plant | C | 0 | 0 | 0 | 0 | 0 | 0 | 0 | 0 | 0 | 0 | 0 | 0% | 0 | 0 | 0 | 0 |
Gunbower / Leitchville treatment plant | C | 16 | 0 | 0 | 0 | 0 | 0 | 0 | 16 | 0 | 0 | 16 | 100% | 0 | 0 | 0 | 0 |
Heathcote treatment plant | C | 73 | 0 | 0 | 0 | 73 | 0 | 0 | 0 | 0 | 0 | 73 | 100% | 0 | 0 | 0 | 0 |
Kyneton treatment plant | B,C | 1,242 | 0 | 0 | 0 | 0 | 0 | 154 | 233 | 0 | 0 | 386 | 31% | 0 | 0 | 855 | 0 |
Lockington treatment plant | C | 0 | 0 | 0 | 0 | 0 | 0 | 0 | 0 | 0 | 0 | 0 | 0% | 0 | 0 | 0 | 0 |
Pyramid Hill treatment plant | C | 22 | 0 | 0 | 0 | 0 | 0 | 0 | 0 | 0 | 0 | 0 | 0% | 22 | 0 | 0 | 0 |
Rochester treatment plant 1 | B | 0 | 0 | 0 | 0 | 0 | 0 | 0 | 0 | 0 | 0 | 0 | 0% | 0 | 0 | 0 | 0 |
Wedderburn treatment plant | C | 42 | 0 | 0 | 0 | 0 | 0 | 0 | 42 | 0 | 0 | 42 | 100% | 0 | 0 | 0 | 0 |
Total 2022-23 | 10,810 | 0 | 0 | 0 | 189 | 0 | 453 | 1,210 | 0 | 0 | 1,850 | 17% | 68 | 0 | 8,890 | 0 | |
Total 2021-22 | 10,459 | 0 | 0 | 0 | 444 | 137 | 447 | 1,121 | 0 | 0 | 2,149 | 21% | 520 | 0 | 7,792 | 0 |