About the area
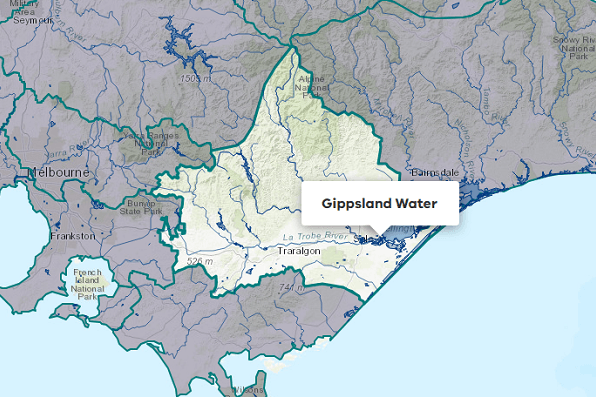
East Gippsland Water’s service area spans 21,000 km2. It extends from Lindenow in the west through to Mallacoota in the east and north to Dinner Plain in the Victorian Alps.
Key population centres include Bairnsdale and the holiday centres of Paynesville and Lakes Entrance.
Water services are provided to around 49,000 people via 9 separate water supply systems.
More information on the water corporation can be found at East Gippsland
2022-23 overview
Urban deliveries
4,688 ML of urban residential and non-residential deliveries were made in 2022-23, similar to the previous year (4,286 ML in 2021-22).
Wastewater recycled at treatment plants
81% of wastewater was recycled (2,872 ML of 3,529 ML), similar to 82% in 2021-22.
Water deliveries
Urban systems
East Gippsland Water operates 9 urban water supply systems, including 7 sourced from surface water, one from groundwater and one from both. Water is sourced from the East Gippsland, Mitchell, Murray, Snowy and Tambo basins.
Table 1: Urban system water balance, East Gippsland Water
Area / town / system | Start volume in store (ML) | Total inflows (ML) | Outflows (ML) | End volume in store (ML) | Distribution system efficiency (%) | ||||||
---|---|---|---|---|---|---|---|---|---|---|---|
Urban residential deliveries | Urban non-residential deliveries | Evaporation | Passed to other systems | System losses | Unattributed outflows | Total outflows | |||||
Bemm River | 6 | 13 | 7 | 6 | 0 | 0 | 1 | 0 | 15 | 4 | 93% |
Buchan | 0 | 21 | 8 | 7 | 0 | 0 | 6 | 0 | 21 | 0 | 70% |
Cann River | 3 | 34 | 13 | 15 | 0 | 0 | 7 | 0 | 35 | 3 | 80% |
Dinner Plain | 0 | 80 | 28 | 13 | 0 | 0 | 39 | 0 | 80 | 0 | 51% |
Mallacoota | 34 | 185 | 87 | 46 | 26 | 0 | 28 | 0 | 187 | 32 | 71% |
Mitchell System 1 | 1,533 | 4,271 | 2,620 | 1,235 | 197 | 18 | 279 | 0 | 4,349 | 1,455 | 89% |
Omeo | 11 | 46 | 21 | 22 | 0 | 0 | 2 | 0 | 45 | 11 | 96% |
Orbost System | 53 | 789 | 222 | 321 | 10 | 0 | 235 | 0 | 788 | 54 | 69% |
Swifts Creek | 4 | 30 | 10 | 7 | 0 | 0 | 13 | 0 | 31 | 3 | 57% |
Total 2022-23 | 1,644 | 5,469 | 3,016 | 1,672 | 233 | 18 | 610 | 0 | 5,551 | 1,562 | |
Total 2021-22 | 1,532 | 5,173 | 2,819 | 1,467 | 220 | 22 | 536 | 0 | 5,064 | 1,644 |
Recycled water
Water recycled at wastewater treatment plants can be used to supplement water available in river basins. Table 2 lists the wastewater treatment plants managed by East Gippsland Water. Water discharged to the environment from treatment plants is included as an inflow to the water balance for each of the river basins.
More information can be found in How we account for water supply.
Table 2: Treated wastewater produced and recycled, East Gippsland Water
Wastewater treatment plant | Class of water | Inflows to plant (ML) | Recycled water end use (ML) | Total water recycled (ML) | Discharge (ML) | ||||||||||||
---|---|---|---|---|---|---|---|---|---|---|---|---|---|---|---|---|---|
Volume treated wastewater produced | Other inflow | Volume supplied to retailers | Domestic / residential | Municipal | Commercial | Industrial | Agriculture | Beneficial allocation | Within process | Total volume recycled | Total % recycled | Released to land | Ocean outfall discharge | Inland water discharge | Other outflow | ||
Bairnsdale treatment plant 1 | C | 1,393 | 0 | 0 | 0 | 0 | 18 | 0 | 0 | 1,362 | 0 | 1,381 | 99% | 0 | 0 | 0 | 12 |
Bemm River treatment plant 2 | C | 9 | 0 | 0 | 0 | 0 | 0 | 0 | 0 | 0 | 0 | 0 | 0% | 8 | 0 | 0 | 1 |
Cann River treatment plant 3 | C | 23 | 9 | 0 | 0 | 0 | 0 | 0 | 1 | 0 | 0 | 1 | 2% | 0 | 0 | 32 | 0 |
Dinner Plain treatment plant 4 | C | 50 | 13 | 0 | 0 | 0 | 0 | 0 | 63 | 0 | 0 | 63 | 100% | 0 | 0 | 0 | 0 |
Lakes Entrance treatment plant 5 | C | 838 | 0 | 0 | 0 | 0 | 36 | 0 | 544 | 0 | 0 | 580 | 69% | 0 | 0 | 180 | 78 |
Lindenow treatment plant 6 | B | 17 | 0 | 0 | 0 | 0 | 0 | 0 | 0 | 10 | 0 | 10 | 56% | 0 | 0 | 0 | 8 |
Mallacoota treatment plant 7 | C | 128 | 5 | 0 | 0 | 0 | 3 | 0 | 130 | 0 | 0 | 133 | 100% | 0 | 0 | 0 | 0 |
Metung treatment plant 8 | C | 186 | 153 | 0 | 0 | 0 | 0 | 0 | 235 | 0 | 0 | 235 | 69% | 0 | 0 | 105 | 0 |
Omeo treatment plant 9 | C | 38 | 2 | 0 | 0 | 0 | 0 | 0 | 23 | 0 | 0 | 23 | 56% | 0 | 0 | 18 | 0 |
Orbost treatment plant 10 | C | 298 | 99 | 0 | 0 | 0 | 0 | 0 | 255 | 0 | 0 | 255 | 64% | 0 | 0 | 142 | 0 |
Paynesville treatment plant 11 | C | 548 | 0 | 0 | 0 | 0 | 0 | 0 | 192 | 0 | 0 | 192 | 35% | 0 | 0 | 259 | 98 |
Total 2022-23 | 3,528 | 281 | 0 | 0 | 0 | 57 | 0 | 1,443 | 1,372 | 0 | 2,873 | 81% | 8 | 0 | 736 | 197 | |
Total 2021-22 | 3,808 | 770 | 0 | 0 | 0 | 32 | 0 | 1,587 | 1,521 | 0 | 3,139 | 82% | 8 | 0 | 1,248 | 180 |