About the area

Greater Western Water was formed from the integration of Western Water and City West Water on 1 July 2021.

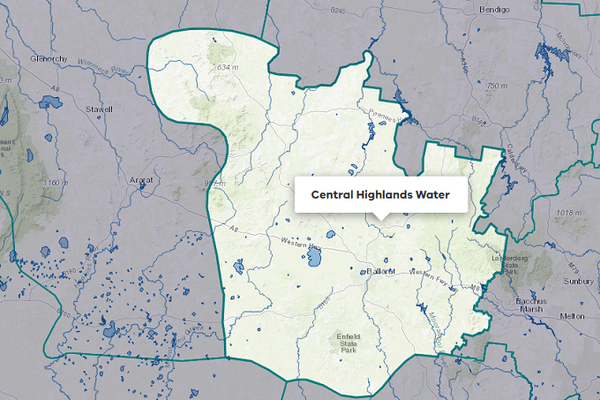
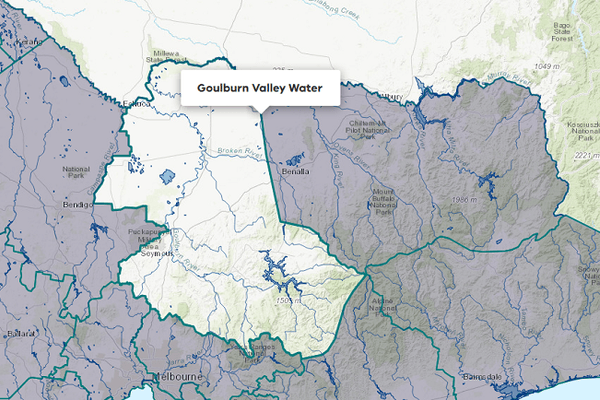
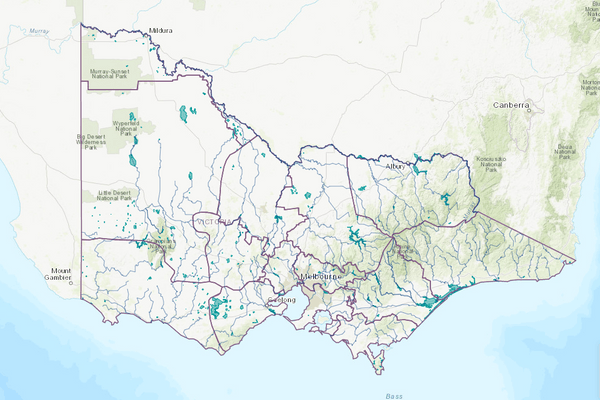
Greater Western Water’s service area covers 3,700 km2, extending from Melbourne’s CBD to Werribee, Bacchus Marsh and the Macedon Ranges.

Greater Western Water services are provided to around 615,000 customers via 3 separate water supply systems.

More information on the water corporation can be found at Greater Western Water.External Link

2022-23 overview

Urban deliveries

119,781 ML of urban residential and non-residential deliveries were made in 2022-23, similar to the previous year (117,842 ML).

Wastewater recycled at treatment plants

32% of wastewater was recycled (5,642 ML of 17,572 ML), similar to 35% in 2021-22.

Water deliveries

Urban systems

Greater Western Water operates 3 urban water supply systems, including 2 sourced from surface water and one that also incorporates groundwater. Water is sourced from the Bunyip, Campaspe, Goulburn, Maribyrnong, Thomson, Werribee and Yarra basins.

Table 1: Urban system water balance, Greater Western Water

Area / town / systemStart volume in store (ML)Total inflows (ML)Outflows (ML)End volume in store (ML)Distribution system efficiency (%)
Urban residential deliveriesUrban non-residential deliveriesEvaporationPassed to other systemsSystem lossesUnattributed outflowsTotal outflows
City West Water 10114,19463,64840,1970010,28761114,194091%
Main integrated system 22,17719,45513,5122,39046202,944019,3082,32482%
Myrniong 304515190011045075%
Total 2022-232,177133,69477,17542,606462013,24261133,5472,324 
Total 2021-222,337129,34976,28141,561195011,4540129,4912,195 

Recycled water

Water recycled at wastewater treatment plants can be used to supplement water available in river basins. Table 2 lists the wastewater treatment plants managed by Greater Western Water. Water discharged to the environment from treatment plants is included as an inflow to the water balance for each of the river basins.

More information can be found in How we account for water supply.

Table 2: Treated wastewater produced and recycled, Greater Western Water

Wastewater treatment plantClass of waterInflows to plant (ML) Recycled water end use (ML) Total water recycled (ML) Discharge (ML)
Volume treated wastewater producedOther inflowVolume supplied to retailersDomestic / residentialMunicipalCommercialIndustrialAgricultureBeneficial allocationWithin processTotal volume recycledTotal % recycledReleased to landOcean outfall dischargeInland water dischargeOther outflow
Altona treatment plant 1C6,042000272001,12600181,37223%04,4330237
Parwan (Bacchus Marsh) treatment plant 2C80900000157730078897%00021
Riddells Creek treatment plant 3C14600050051005639%206424
Gisborne treatment plant 4B9682670011505026728823%0093413
Melton treatment plant 5A,C6,1957330432010401,82302262,58437%004,061283
Romsey treatment plant 6C3492490061302300024942%0031930
Sunshine Golf Course Sewer Mining Plant treatment plantn/a000000000000%0000
Woodend treatment plant 7C3440005230000288%6027238
Sunbury treatment plant 8B2,719000541740500027710%002,38359
Total 2022-23 17,5721,24904321085191,1412,93205115,64232%84,4338,033705
Total 2021-22 16,7911420316815381,4353,20702845,86235%503,8345,6031,584