On this page:
About surface water
Surface water is water that occurs or flows on land. It includes water in waterways and in lakes, reservoirs, dams, wetlands and other water bodies. A waterway is a river, creek, stream, watercourse or natural channel where water regularly flows. This flow does not need to be continuous.
River basins are the primary reporting unit for surface water information for these Accounts. We explain more about surface water resources in Water resources.
This page reports on statewide surface water availability, use, compliance and trade for 2022-23.
We report on availability, use and compliance in each of the 29 river basins in the surface water local reports.
2022-23 overview
More water was available
The volume of surface water available in river basins was around 50% higher than last year.
Fewer restrictions on licensed diversions
There were fewer restrictions on unregulated stream sections than in the previous year.
Higher seasonal allocations
More water was available from seasonal determinations due to some systems receiving their first ever low-reliability allocations.
About the same amount of water was used
Around 2% less water was taken for consumptive use than the previous year.
When compared to the previous year, in 2022-23:
- more water was available (49,087,047 ML compared to 33,025,526 ML in 2021-22)
- there was more water in storages (levels in Victoria’s major storages were 92% in June 2023 compared to 84% in June 2022)
- more water was allocated to users
- there were fewer restrictions on licensed diversions from unregulated streams (a peak of 52 stream sections in March 2023 compared to 67 in February 2022)
- less desalinated water was produced (4.1 GL compared to 125 GL in 2021-22)
- a similar volume of water was diverted for consumptive uses (2,850,249 ML compared to 2,919,232 ML in 2021-22)
- less water was diverted for environmental uses (612,279 ML compared to 1,008,424 ML in 2021-22)
- there was an increase of around 103 GL in entitlement volume from 2021-22, mainly due to amendments as part of water recovery projects in Northern Victoria
- there was a similar volume of trade of allocation, less trade of water shares, and less net interstate trade into Victoria.
Table 1 reports on the total available water, total entitlements and total use (consumptive and environmental). In 2022-23, 3,462,528 ML of surface water was taken for consumptive and environmental purposes in Victoria (Table 1).
Table 1: Available surface water and use
Water availability
Surface water availability across the state is presented as a report on streamflows and storage levels. Streamflow is equivalent to catchment inflow in the river basin water balances in each of the surface water local reports.
Overall, there was more water available in 2022-23 than the previous year:
- 217% of long-term average streamflows were received in Victoria (compared to 146% in 2021-22). This was the highest volume received of the past 20 years.
- Total Victorian storage levels reached a peak of 98.4% in December 2022 compared to the peak of 88.9% in November 2021.
Total Victorian streamflows
Compared to the previous year, there was more rainfall in 2022-23 across most of the state, and most waterways received more streamflows. Reflecting the very much above average rainfall received across the state, all 29 basins had above average streamflows (compared to 16 basins in 2021-22).
During the year, there was a negative Indian Ocean Dipole and a La Niña event. Both events are commonly associated with increased rainfall across the state. For more information on water availability, see Year In Water.
A note on 2022-23 streamflow reporting
The Accounts uses gauged streamflow at a variety of representative locations to estimate 3 figures which are central to the water balance:
- outflows at the bottom of each river basin
- losses in-stream, for basins where this figure is modelled
- catchment inflow to each basin, which is summed across all basins and reported as total Victorian streamflows on this page.
Large rainfall events across much of the state in October 2022 resulted in high flows, which impacted the ability of gauges to provide accurate streamflow estimates for nine basins: Barwon, Hopkins, Kiewa, Loddon, Moorabool, Otway Coast, Ovens, Tambo and Wimmera. Alternative methods have been required in these basins, which have a lower confidence than the method typically used. However, these alternative methods are considered fit for this purpose of basin-scale water accounting.
An explanation of the methods applied can be found in the method tab of Figure 1 and Table 2.
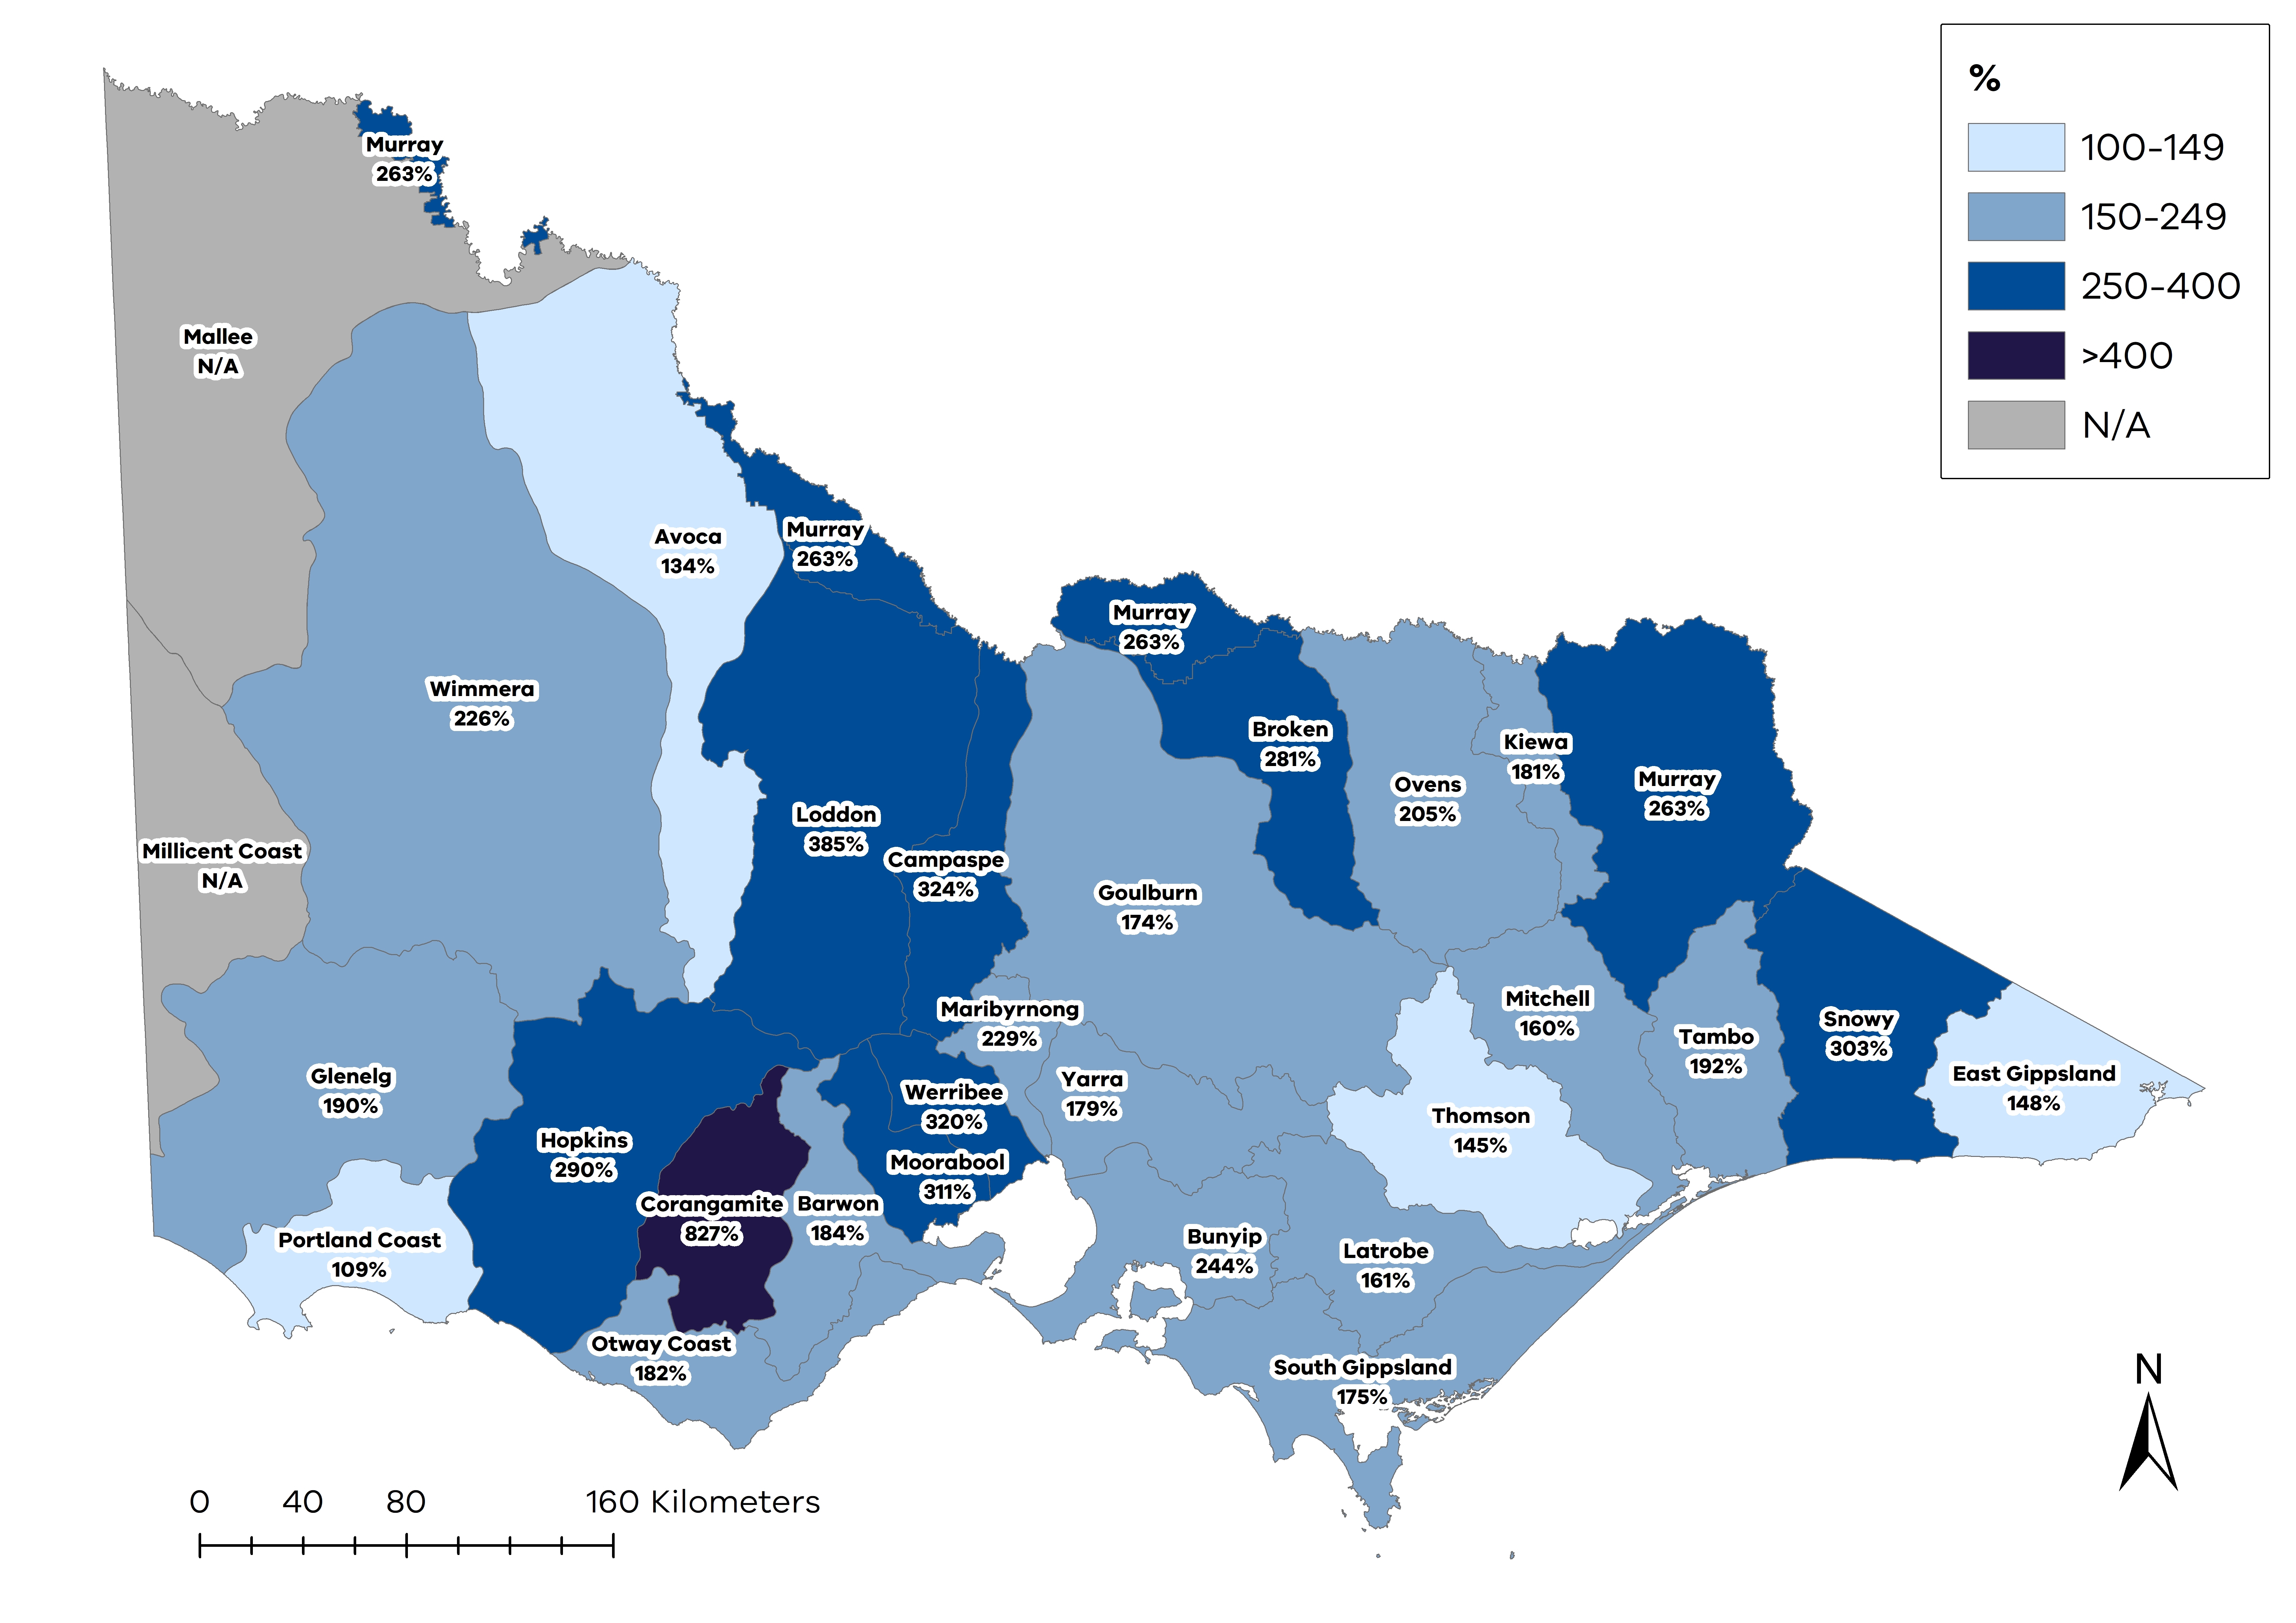
The total annual streamflow volume for Victoria was 49,087,047 ML, 217% of the long-term average inflows received from 1975 to 2019. This was more than the volume in 2021-22, which was 33,025,526 ML, 146% of the long-term average.
In 2022-23:
- 25 out of 29 river basins had higher annual streamflow volumes than in 2021-22
- the Avoca basin received the least amount of streamflow compared to the average, receiving 134% of the long-term average inflows
- the Corangamite basin received the highest inflows compared to average: 717,840 ML, equivalent to 827% of the long-term average
- statewide, streamflow volumes were the highest received of the past 20 years.
Melbourne system inflows
The annual natural inflows (excluding desalinated water) to Melbourne’s harvesting reservoirs in 2022-23 were 880,729 ML, 183% of the 30-year average (480,979 ML, from 1992-93 to 2021-22). This is more than the volume of inflows received the previous year (643,200 ML, 133% of the 30-year average).
Melbourne has received above long-term average inflows into storages for the last 4 years. However, inflows into storages have been below the long-term average in 14 of the past 20 years.
Figure 3 below shows the annual inflows into Melbourne's primary harvesting storages (Maroondah, O'Shannassy, Upper Yarra and Thomson reservoirs).
Storages
Victoria's major water storages can hold approximately 12,405 GL. Of this, Melbournes storage capacity is approximately 1,812 GL, and the capacity of the states major regional storages is approximately 10,593 GL. The combined volume of water stored in Victoria's reservoirs varies both within a given year and between years.
Total Victorian storage levels started the year at 10,393 GL (84%) and peaked at 98% in December 2022 (compared to 89% in November 2021). Levels finished the year at 11,410 GL (92%) at the end of June 2023.
Total Victorian storages
Victorian major storages were 92% at end June 2023 (compared to 84% end of June 2022).
Melbourne storages
Melbourne storages were 92% at end June 2023 (compared to 87% end of June 2022).
Regional storages
Regional storages were 93% at end June 2023 (compared to 84% end of June 2022).
Regional storage levels
In 2022-23, total regional storage levels:
- started the year at 84% in July 2022
- peaked at 99% in December 2022 (compared to 89% in November 2021)
- finished the year at 93% at end of June 2023 (compared to 84% in June 2022).
Melbourne storage levels
In 2022-23, total Melbourne storage levels:
- started the year at 1,573 GL (87%)
- reached a peak of 1,775 GL (98%) in November 2022 (compared to 90% in November 2021)
- finished the year at 1,660 GL (92%) at the end of June 2023 (compared to 87% in June 2022).
Storages in major urban centres
The total volume of water stored in Victoria’s major reservoirs has historically been at its highest following winter and spring inflows. Storage levels at the end of October are traditionally a good indication of water availability for the remainder of that year.
Figure 6 presents end-of-October storage levels as a percentage of storage capacity for Melbourne and selected major regional centres from October 2003 to October 2022.
At the end of October 2022, storages were between 94% and 98%:
- The regional storages were all between 94% and 97%, this was similar to the previous year when regional storages were all between 95% and 99%.
- Melbourne storages were at 98%, higher than in the previous year when they were at 87%.
Response to availability
The amount of water available for consumptive and environmental uses will vary from year to year. The entitlement and planning frameworks include mechanisms to conserve and share water between users in response to seasonal variability and water shortages. The Victorian Desalination Project is a climate independent water source that enables the state to supplement water supplies when needed.
We have provided more information on these mechanisms in How is water
As there was more water available in 2022-23, there were higher seasonal allocations and fewer restrictions on licensed diversions from unregulated stream sections. As in 2021-22, all towns remained on permanent water-saving rules (with no additional restrictions), no water carting was required and there were no temporary qualifications of rights to water.
Fewer unregulated stream restrictions
There were fewer unregulated stream sections on bans or restrictions than in the previous year.
Higher seasonal determinations
Licence holders had access to more water in 2022-23 than in the previous year.
Urban restrictions were the same
All towns remained on permanent water-saving rules for the whole of 2022-23, the same as the previous year.
Seasonal allocations
In 2022-23, seasonal allocations to high-reliability entitlements in all declared water systems reached 100%, the same as the previous year. This year however, all northern systems received a 100% allocation to low-reliability entitlements, making this the first time all northern Victorian systems have received a 100% seasonal determination for both high-reliability and low-reliability water shares since the creation of the current entitlement products in 2007.
Opening allocations announced in July 2022 were higher than the previous year in the northern declared systems. Opening allocations were the same as the previous year in the non-declared and southern systems, except for Werribee which opened lower.
By December 2022, all northern and southern systems had received seasonal allocations of 100% high-reliability water shares. All low-reliability entitlements in Victoria also reached the maximum allocation of 100% at this time; except in the Thomson/Macalister system, which received 100% in April 2023.
Table 3: Seasonal water allocations in regulated water systems
Unregulated stream diversion restrictions
There were fewer unregulated stream sections with restrictions on licensed diversions in 2022-23 (Figure 7).
- The number of unregulated stream sections under restrictions and bans reached a peak of 52 in March 2023 compared to 67 in February 2022.
- There were 43 stream sections on restrictions at the end of 2022-23 compared to 47 at the end of 2021-22.
Desalinated water
Water produced by the Victorian Desalination Project is transferred into Cardinia Reservoir and combined with water sourced from upstream catchments and reservoirs, including O’Shannassy Reservoir, Upper Yarra Reservoir and Thomson Reservoir.
The Minister for Water made a 15 GL water order for 2022-23. This order was cancelled part way through delivery and the total volume delivered for the year to 30 June 2023 was 4.1 GL, less than the previous year (125 GL).
Water use
In Victoria water can be taken from reservoirs, streams and aquifers under entitlements issued and authorised under the Water Act 1989.
In addition to formally issued entitlements, the Act enables individuals to take water for domestic and stock use from a range of surface water and groundwater sources without a licence (for example, from a small catchment dam).
The volume of water taken presented in this overview and in the river basin local reports is reported as the volume of water diverted from a water source. It is the bulk volume of water extracted from the waterways net of any volume returned. It is not always calculated from the end use on a farm or in a town.
We explain more about the water entitlement and planning frameworks in How is water managed?
Use by type
Table 4 represents the use of water in each basin. In some cases, these volumes differ slightly from the volumes of water taken under entitlements in each basin in Table 6. This is because Table 6 reports water taken under entitlements based on the source basin for each entitlement, while Table 4 reports water that was used within each basin. Some entitlements may source their water from one basin and then transfer it to be used in another basin. For example, in 2022-23 1,142 ML was transferred from the Goulburn basin to supply urban use in the Yarra basin. In Table 6, the 1,142 ML is reported in the Goulburn basin as a water taken under the entitlement, but in Table 4 the same volume is reported against the Yarra basin instead of the Goulburn.
In 2022-23, 3,462,528 ML of surface water was taken for consumptive and non-consumptive purposes in Victoria (3,927,656 ML in 2021-22).
Of this, 2,850,249 ML was taken for consumptive uses, less than the 2,919,232 ML taken in 2021-22. This includes water used for:
- irrigation: 1,962,749 ML (57% of total use)
- urban: 682,056 ML (20% of total use)
- small catchment dams: 167,638 ML (5% of total use)
- power generation: 37,806 ML (1% of total use).
In addition to the consumptive use, 612,279 ML was delivered to the environment under entitlements (18% of total use). This includes both in-stream and off-stream deliveries. There was an additional 8,339 ML of managed passing flows delivered in 2022-23. This was less than the 1,015,677 ML delivered the previous year (1,008,424 ML under entitlements and 7,253 ML through managed passing flow deliveries).
Table 4: Surface water use by type
Entitlements and compliance
Entitlement volumes
Entitlements provide the basis for how water is shared. The total volume of entitlements changes each year as new entitlements are issued or existing entitlements are modified.
All basins in the state have a cap, which limits the volume of water that can be allocated. In catchments that have reached the cap and allocated all available water within the limit, no new entitlements are created unless water savings are made, and so there is no net increase in entitlement volume. This cap and trade system means that the only way for a water user to get more entitlement is to purchase it from someone selling unwanted or unused entitlement.
Most basins in Victoria have reached their cap, and so only a minor change in the total statewide volume of entitlements on issue is likely to occur annually.
Here is the list of Bulk and Environmental Entitlement holders as at 30 June . Visit the Water Register for up-to-date information on bulk entitlements.
Amendments as part of water recovery projects in Northern Victoria
Further changes to entitlements occurred in 2022-23 as part of the GMW Connections Project, the GMW Water Efficiency Project and two investments in modernising water delivery infrastructure in the Goulburn-Murray Irrigation District (GMID). Following completion of on-ground works, the consequent water-savings were allocated as entitlements. These changes during the 2022-23 year include:
- adjustments to the total volume of bulk entitlements held by the Victorian Environmental Water Holder (VEWH) in the Campaspe, Goulburn, and Murray systems (net reduction of 856 ML)
- issue of 91 GL of bulk entitlements from the Melbourne retailers’ share in the Murray and Goulburn systems
- changes to reflect the issuing of 9 GL of water shares as part of the irrigators’ share in the Goulburn, Murray, Loddon, and Campaspe systems
- changes to reduce the corresponding loss allowances underwriting water recovery in the Murray and Goulburn Systems.
Other amendments
Other changes to bulk entitlements include:
- name changes to all bulk entitlements held by Greater Western Water to reflect the integration of City West Water and Western Water, and to amalgamate Greater Western Water’s two Greater Yarra system - Thomson River pool bulk entitlements into one
- changes to reflect the conversion of water shares held by GMW into a bulk entitlement by adding 14.6 ML of high-reliability entitlement to the volume of water available for the Mitiamo Waterworks District in the Goulburn system
- changes to reflect the new Melbourne Water storage manager appointment across all Melbourne system bulk entitlements.
All changes to bulk entitlements are administered under part 4, division 1 of the Act and require consultation and consideration of matters including the impact on current users and the environment.
Table 5: Entitlement volumes by owner type
Water available under entitlements
Table 6 represents the total volume of water that was available, and taken, under entitlements in each basin in 2022-23. The volumes for each basin will differ from Table 4, where the volumes represent the use of water in each basin. Some entitlements may source their water from one basin and then transfer it to be used in another basin. For example, in 2022-23, 571 ML was transferred from the Kiewa basin to supply Beechworth in the Ovens basin. In Table 6, the 571 ML is reported in the Kiewa basin as water taken under the entitlement, but in Table 4, the same volume is reported against the Ovens basin where the water was used.
The total available water volume in Table 6 is the sum of: opening carryover, allocation issued and the net trade of water (trade in less trade out), less water lost to spill.
Table 6 shows that in 2022-23:
- there was 6,610,602 ML of water available (less than the 6,931,700 ML available in 2021-22)
- there was 3,340,785 ML of water taken under entitlements (less than the 3,852,942 ML taken in 2021-22).
Table 6: Water available and taken under entitlements
Compliance
Compliance against water entitlements is reported in these Accounts in 3 areas:
- entitlement issued: that the volume of entitlements issued in a basin does not exceed formal caps or has not increased without appropriate approvals
- water taken: that the volume of water taken during the year does not exceed the volume considered to be available for consumptive and/or in-stream use during that year
- bulk entitlement provisions: that holders of bulk entitlements do not breach any provisions that are documented in their bulk entitlement orders.
Total entitlement volume
There was an allowable net increase in the total entitlement volume from the previous year. See note below.
Total volume diverted
At a state scale, the total volume diverted under entitlements (3,340,785 ML) was within the volume available for the year (6,610,602 ML).
Individual bulk entitlements
No individual bulk entitlement holder took more than the annual volume made available to them.
Exceptions to compliance
Individual bulk entitlement holders reported 12 instances of failures and difficulties experienced in complying with entitlement provisions. More detail has been provided in the Murray, Ovens, Broken, Goulburn, Campaspe, Latrobe, Maribyrnong, Werribee, Moorabool and Barwon basins.
Note to increase in total entitlement volume:
- All increases have been made in accordance with the relevant rules. See explanations in the Entitlement volumes section above and in the accounts for the Murray, Goulburn, Campaspe, Loddon, Tambo, South Gippsland and Glenelg basins.
Water leaving the basin
Water leaving the basin is water that flows out of basins at their downstream ends. This includes all water flowing through the system, excluding diversions and losses. In terms of water for the environment, it includes managed environmental water delivered in-stream, obligations on consumptive entitlements (such as passing flows) and above cap water. This water flowing through the system provides environmental, social, recreational and cultural benefits.
Although water leaving the basin provides environmental benefits, the proportion of flows leaving Victorian river basins is not in itself a reliable indicator of river health. This is due to the complex interaction of ecological processes and the seasonal variability of streamflows.
In 2022-23, at a statewide scale, water leaving river basins was higher than the previous year. A total of 41,595,780 ML left river basins compared to 27,155,480 ML in 2021-22.
As a percentage of total flows in basins, water leaving the basin was about the same as the previous year, with 85% reaching basin outlets in 2022-23, compared to 82% the previous year.
At a basin scale, when compared to the previous year, the proportion of total flows leaving the basin in 2022-23 increased in 19 basins, decreased in 3 basins and remained the same in 5 basins.
Table 7: Water leaving the basin
Trade
Water markets provide water users flexibility in the quantity and timing of their water use. For some parties water markets are key to their operations and they rely on allocation trade rather than entitlement ownership.
More allocation trade
The volume of priced trades in northern Victoria (1,369,298 ML) was the highest on record.
Less net interstate trade
There was 41,887 ML of net water trade into Victoria compared to 59,813 ML in the previous year (non-environmental water).
Less water share transfer
89,101 ML of high-reliability water shares transferred ownership compared to 122,728 ML in the previous year.
Note: Groundwater trade is covered in Statewide groundwater.
For further information:
- An introduction to the water trading framework in Victoria can be found in How is water managed?
- A more detailed breakdown of water trade for 2022-23 can be found in the Victorian Water Trading 2022-23 Annual
- Trade of Water in Victoria is subject to trade rules and limits. Information on trade rules can be found on the Water Register
Allocation trade
Allocation is water available each season under water entitlements. Water is allocated based on the availability of water in any given year. These water allocations can be traded subject to trade
Allocation trade has been broken down into 3 categories:
- Commercial trade indicates a normal trade, with water transferred between water accounts at an agreed price.
- Zero-priced trade indicates a movement of water to another account for zero dollars. These trade applications may indicate a trade between accounts owned by the same person, between related parties as part of an entitlement transfer, a contractual lease, or carryover parking return.
- Environmental trade indicates trade between environmental water accounts, or zero-priced trades between private and environment water accounts.
In 2022-23, a total of 3,631,717 ML of allocation was traded in Victoria, a similar amount to the total of 3,579,136 ML traded in 2021-22.
Most of the allocation trade occurred in northern Victoria (3,620,967 ML), with a small volume traded in southern Victoria (10,750 ML) and no allocation traded in western Victoria. In 2022-23, the volume of priced trades in northern Victoria was the highest on record: 1,369,298 ML. This is consistent with the trend of increasing allocation trade since 2007-08.
Environmental water holders are significant participants in the water allocation market, using trade to move water across Victoria. These organisations, primarily the Victorian Environmental Water Holder (VEWH) and the Commonwealth Environmental Water Holder (CEWH), aim to sustain healthy ecosystems and waterways. Environmental trade made up 37% of the total volume traded in 2022-23, lower than the previous year. These trades were zero-priced, primarily moving water between environmental water accounts.
Table 8: Summary of seasonal allocation trade
Trade in northern Victoria
A total of 2,251,669 ML of zero-priced trade (non-environment zero priced trades and environmental trades) occurred in northern Victoria in 2022-23. A total of 1,369,298 ML of priced trade (commercial trades) occurred in northern Victoria in 2022-23 (Figure 12).
Trade between Vic, NSW and SA
Water trade between Victoria, New South Wales (NSW) and South Australia (SA) is permitted subject to trading rules. Victoria has tended to be a net importer of water over the past decade, largely due to the high demand from irrigators in the lower Murray. Flooding and extremely wet conditions in Victoria in 2011-12 and 2012-13 led to the net export of water from Victoria to NSW, as did extremely dry conditions in NSW in 2017-18 and 2018-19.
In net terms during 2022-23, excluding within-environment trade(Figure 13):
- Victoria imported 13,158 ML of water from NSW, compared to 97,526 ML imported in the previous year
- Victoria imported 28,729 ML from SA, compared to 37,713 ML exported in the previous year
- there was 41,887 ML of interstate trade into Victoria. This is a decrease from the net total of 59,813 ML into Victoria in the previous year.
Water share transfer
Trade of water shares represents a trade of ongoing annual water entitlements in declared systems. Most of the state’s regulated water systems have been declared.
Water shares can be high-reliability or low-reliability:
- High-reliability water shares have priority to receive allocations based on available water resources
- Low-reliability water shares only receive allocations when managers of the resource have allocated 100% high-reliability water shares and there is confidence that future water commitments won’t be compromised. Low-reliability water share accounts are often used to carry over allocations from previous seasons.
From 2009-10 to 2011-12, large volumes of water shares were transferred to the Commonwealth Environmental Water Office as part of buyback programs under the Basin Plan, resulting in much higher overall transfer volumes.
In 2022-23, water share transfer across Victoria included (Figure 14 and Table 9):
- 89,101 ML of high-reliability water shares transferring ownership; this is a decrease from the previous year (122,728 ML).
- 47,497 ML of low-reliability water shares transferring ownership; this is a slight decrease from the previous year (49,823 ML).
Table 9: Water share transfers
Most of this trade occurred in northern Victoria, with a small amount in southern Victoria. Western Victoria does not have declared systems, so it has no water shares.
Unregulated surface water trade
Outside declared water systems, take and use licences allow water to be taken from either unregulated surface water systems or from groundwater, and to be used subject to the conditions defined in the licence.
Unlike allocation and water share trading, most of the surface water take and use licence trading occurred in southern Victoria, with very small volumes traded in the west of the state. Trades as part of land transfers were the most common trade type.
In 2022-23, surface water take and use licence trading resulted in:
- 868 ML of unregulated surface water permanently traded (not as part of a land transfer). This was slightly less than the 955 ML permanently traded in the previous year
- 3,144 ML of unregulated surface water temporarily traded. This was less than the 3,611 ML temporarily traded in the previous year
- 11,634 ML of unregulated surface water traded as part of a land transfer. This was similar to 10,703 ML traded as part of a land transfer in the previous year.
Table 10: Trade of surface water take and use licences
Trade in surface water take and use licences was less than trade in groundwater take and use licences. For information on groundwater trade see the trade section in Statewide groundwater.