On this page:
Message from the Minister

Welcome to the 2023-24 Victorian Water Accounts (VWA).
The VWA, now in their 21st year, have charted the ups and downs of water availability and use since the later years of the Millennium Drought. They provide a valuable data resource for researchers and policymakers, as well as important transparency for all Victorians about the way our precious water is managed and used.
The 2023-24 VWA saw dry conditions across much of southern and western Victoria following two years of above average rainfall, impacting many farming communities dependent on rainfall. In the south-west of the state, nine of the 12 months saw below average rainfall, with parts of the region experiencing their lowest rainfall on record during September, March, and May.
The total volume of water available – including surface water, groundwater, recycled water and desalinated water – was just under 23,000 gigalitres (GL), significantly less than the 50,600 GL available the previous year when Victoria experienced significant flooding. For a comparison, a single GL is the equivalent of around 400 Olympic Swimming Pools.
In line with lower rainfall and lower water availability, rural Victorian water users experienced an increase in restrictions on surface water take and slightly lower seasonal allocations compared to 2022-23. Overall, storage levels dropped from 92% to 82%.
Total water use was approximately 15% higher than the previous year. Of the total water used, approximately:
- 57% supported irrigation
- 22% delivered environmental benefits to rivers and wetlands
- 17% supplied our towns and cities
- 3% was used for rural domestic and stock use
- 2% was used for power generation.
The insights from the Victorian Water Accounts continue to inform planning when considering what a climate change-impacted future may look like and its impact on our precious water resources. These Accounts provide vital insights to support the Victorian Governments drought support measures and development of the Water Security Plan and its detailed investigations.
Enjoy browsing the 2023-24 Victorian Water Accounts.
THE HON GAYLE TIERNEY
Minister for Water
November 2025
Overview
Drier conditions
Less rainfall was received across the state, with less water flowing down rivers and into storages than the previous year.
Less water was available
The total available volume of surface water, groundwater and recycled water was lower than the previous year. There was less desalinated water produced.
More stream restrictions
There were more restrictions on licensed diversions from unregulated streams than the previous year.
Urban restrictions were the same
All towns remained on permanent water-saving rules for the whole of 2023-24, the same as the previous year.
The purpose of the Victorian Water Accounts is to report on water availability and use and to demonstrate Victoria’s compliance with its water entitlement framework. It covers different sources of water including surface water, groundwater, recycled water and desalinated water.
Table 1 and Figure 1 report the total available water, and the consumptive and environmental entitlements and use across the state for the last 2 years for each of the 4 different sources of water.
Available water in the Accounts includes:
- the total volume of water that flowed down streams
- the sum of available water in a groundwater management unit (the permissible consumptive volume (PCV) or the entitlement volume where there is no PCV)
- the amount of wastewater treated
- the volume of water produced by the Victorian Desalination Plant.
Entitlement volumes are the maximum volumes authorised to be taken and used by a holder for the year.
Use of surface water and groundwater is the volume of water diverted from a stream or groundwater bore. Recycled water use is the end use of treated wastewater that did not get discharged to the environment or ocean (e.g. for urban, agricultural or commercial uses).
In 2023-24:
- 22,613,346 ML of water was available (less than the 50,599,525 ML in 2022-23 when Victoria experienced significant flooding)
- there was a similar volume of entitlements (7,734,614 ML in 2023-24, compared to 7,862,548 ML the previous year)
- more water was used for consumptive and environmental purposes (4,312,779 ML in 2023-24, compared to 3,757,703 ML the previous year).
Water availability
- Most of the state received less rainfall than in the previous year. Rainfall ranged from the lowest on record in the state’s south-west to above average in parts of the northern country, central Victoria and Gippsland
- September 2023 saw the emergence of a positive Indian Ocean Dipole and an El Niño event, ending in February and April 2024, respectively. Both events forecasted an increased likelihood of warmer and drier conditions that would lead to reduced rainfall across the state during spring and early summer. However, resulting summer 2023-24 rainfall was above average due to a couple of significant low-pressure systems during December 2023 and January 2024.
- Less water was available than the previous year (22,613,346 ML in 2023-24 compared to 50,599,525 ML in the previous year when Victoria experienced significant flooding).
Rainfall
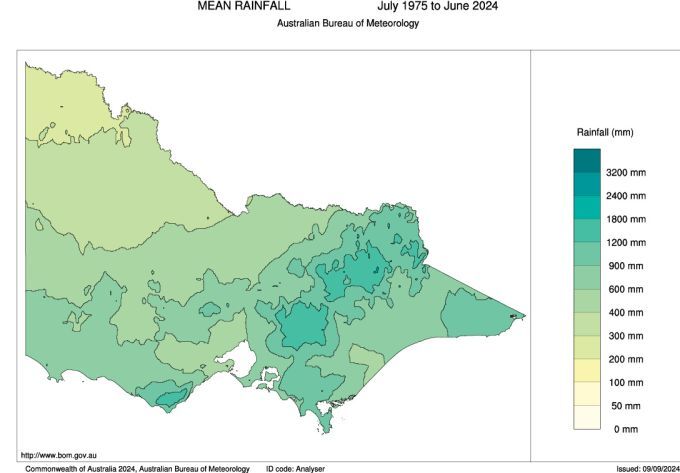
Long-term average rainfall in Victoria (July 1975 to June 2024 - Figure 2a) varies from as low as 200 mm a year in the north-west of the state to up to 1,800 mm a year across the Otway and alpine regions.
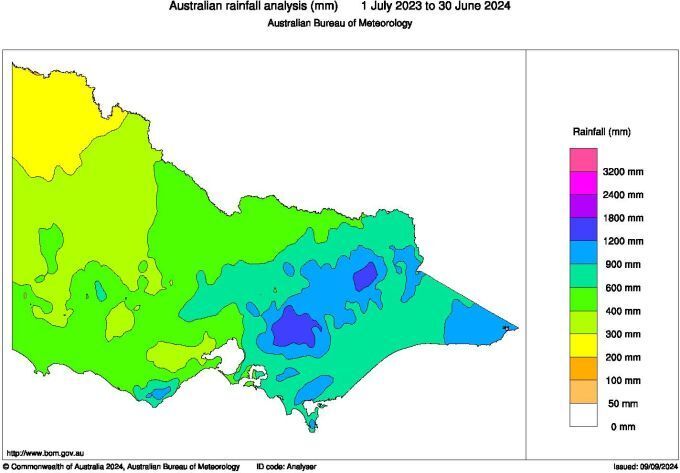
The range for total annual rainfall received in 2023-24 varied across the state from 200 mm to 1,800 mm (Figure 2b). Most of the state received less rainfall than the previous year.
- The lowest rainfall - between 200 mm and 300 mm - was received in the Victoria’s north-west.
- The highest rainfall – between 1,200 mm and 1,800 mm - was received in parts of the Yarra Ranges and the alpine region.
When compared to the 1975 to 2024 reference period, the rainfall received in 2023-24 ranged from the lowest on record in the state’s south-west to above average in parts of the northern country, central Victoria and around Sale (Figure 3). Close to average rainfall was received over most of Victoria in a band ranging from the state’s north-west to the south-east.
Figure 3: Rainfall deciles 2023-24
Sourced from the Australian Bureau of Meteorology
The various layers on Figure 4 show the seasonal pattern of rainfall during the year, relative to the 1975-2024 reference period.
- Winter rainfall was above average in parts of northern Victoria and ranging from below average to the lowest on record over most of southern Victoria.
- Spring rainfall was very much above average around Sale and very much below average in parts of south-western Victoria.
- Summer rainfall was above average or very much above average for almost the whole state.
- Autumn rainfall was below average across much western and eastern Victoria, being the lowest on record in the far south-west.
Figure 4: Seasonal rainfall deciles 2023-24
Sourced from the Australian Bureau of Meteorology
El Niño and a positive Indian Ocean Dipole
On 19 September 2023, the Bureau of Meteorology declared the concurrence of both El Niño and a positive Indian Ocean Dipole (IOD), reporting an increased likelihood of warmer and drier conditions that would lead to reduced rainfall over the spring and early summer period. Despite these events, summer 2023-24 rainfall was largely above average, owing to rain during December 2023 and January 2024 from a couple of significant low-pressure systems.
The IOD began to weaken in December 2023 and returned to neutral in February 2024. El Niño continued until mid-April 2024, following gradual cooling of sea surface temperatures in the central Pacific from December 2023.
Total water available
Overall, the total available volume of Victoria’s surface water, groundwater, desalinated water and recycled water in 2023-24 was 22,613,346 ML (Figure 5 and Table 2), less than the amount available in the previous year when Victoria experienced significant flooding (50,599,525 ML).
- Much less surface water was available.
- About the same amount of groundwater and recycled water was available.
- No desalinated water was produced, less than the previous year when 4 GL was produced.
Table 2: Total available water
Response to water availability
The amount of water available for consumptive and environmental uses varies from year to year. The entitlement and planning frameworks include mechanisms to conserve and share water between users in response to seasonal variability and water shortages. We have provided more information on these mechanisms in the How is water managed?
In 2023-24:
- seasonal allocations were similar to the previous year (see Statewide surface water)
- there were more restrictions on licensed diversions from unregulated streams (see Statewide surface water) and the same number of restrictions on groundwater (see Statewide groundwater)
- all towns remained on permanent water-saving rules, with no additional restrictions on use (see Statewide water supply)
- two instances of water carting were required to address isolated water shortages (see Statewide water supply)
- there were no temporary qualifications of rights to water.
Water use
Water for all types of uses in Victoria is taken from reservoirs, streams and aquifers under entitlements issued and authorised under the Water Act 1989.
Read more about different uses under the entitlement framework in How is water managed?
In 2023-24, 4,312,777 ML of water was used (for consumptive and environmental purposes), more than the previous year (3,757,702 ML) (Figures 6 and 7 and Table 3). This includes surface water, groundwater, recycled water and desalinated water.
- The amount of water used for consumptive purposes was 3,379,746 ML (similar to the 3,145,423 ML used in 2022-23).
- The amount of water delivered to the environment was 933,031 ML (more than the 612,279 ML delivered in 2022-23).
Table 3: Water use by type
Water entitlements
All river basins in the state have a cap on entitlements, and groundwater management units have a permissible consumptive volume (PCV), which limits the volume of water that can be allocated. In areas that have reached the cap/PCV and allocated all available water within the limit, no new entitlements are created unless water-savings are made, so there is no net increase in entitlement volume.
Read more about entitlements in How is water managed?
In 2023-24, the reported entitlement volume is slightly lower than the previous year due to some changes to surface water entitlement volumes (Figure 8 and Table 4). The decrease was mainly due to a decrease in estimated water use by small catchment dams, which is reported as entitlement volume in the Accounts because not all small catchment dams are required to be licensed or registered under the Water Act 1989. Visit Statewide surface water for more information.
Traditional Owner organisations hold surface water and groundwater entitlements. The entitlement volume held by these organisations is included in Table 4 in the consumptive entitlement volume totals. On 30 June 2024, this volume was around 9.3 GL. The organisations used for this estimation include Registered Aboriginal Parties as well as other known Aboriginal organisations and cooperatives.
Table 4: Water entitlements by type
Evapotranspiration
- Evapotranspiration is the sum of all processes by which water moves from the land surface to the atmosphere via evaporation and transpiration. Evapotranspiration amounts vary considerably across Victoria depending on a range of factors including rainfall conditions and land cover.
- Averaged across Victoria as a whole, evapotranspiration in 2023-24 was estimated to be 582 mm.
- This was close to the long-term average evapotranspiration (about 4% above the post-1975 historic climate reference period), and 18% less than the previous reporting period (2022-23).
- When estimated at a basin-scale, evapotranspiration was generally close to average conditions. Evapotranspiration tended to be close to or slightly below average in the south-west of Victoria and the Wimmera-Avon basin. Other Victorian river basins experienced annual evapotranspiration close to or slightly above long-term average conditions.
- Read the for more detail on evapotranspiration in 2023-24.
Looking for more information?
The VWA reports on availability and use across surface water, groundwater, water supply and water for the environment. The structure has changed a bit from the Accounts prior to 2021-22. If you would like to find information equivalent to specific sections in our historical PDF report structure - go to our mapping
Statewide summaries
Learn about different aspects of water availability and use across Victoria in 2023-24.
Local reports
Explore the local water reports by surface water, groundwater or water supply.