On this page:
Overview
The Victorian Water Accounts presents an annual account of surface water, groundwater and water supply systems in Victoria.
This page outlines the basis for the information presented in each of the surface water, groundwater and water supply reports on this site.
It explains some important assumptions and limitations of the data in the Accounts, which should be read in conjunction with the information in the reports.
The Accounts are compiled with information obtained from:
- the Victorian Water Register (VWR)
- the Victorian Water Measurement Information System (WMIS)
- urban and rural water corporations
- the Essential Services Commission (ESC)
- the Murray Darling Basin Authority (MDBA)
- the Bureau of Meteorology (BoM)
- Department of Energy, Environment and Climate Action (DEECA) (for water supply system models)
- the Victorian Environmental Water Holder (VEWH)
- some major industrial users of water.
In this website, we report on surface water, groundwater and water supply via 8 types of water reports.
Surface water reports by:
- river basin
- statewide.
Groundwater reports by:
- groundwater catchment
- groundwater management unit
- statewide.
Water supply* reports by:
- water corporation
- water supply system (e.g. individual town or irrigation system)
- statewide.
* In previous Accounts, water supply systems were referred to as distribution systems instead. The meaning has not changed.
A note on rounding
The Accounts present many tables of data about water availability and use. Figures are rounded up or down to the nearest megalitre (ML), unless otherwise specified. This results in some minor apparent inconsistencies in tables, as the total presented may not exactly equal the sum of each of the rounded values. The differences are minor, and are considered immaterial in the scale of the total volumes in river basins, groundwater management units and water supply systems.
Correcting errors in the Victorian Water Accounts
Each year, the Victorian Water Accounts undergoes rigorous review by many subject matter experts within DEECA. However, on rare occasions, an error in the Accounts is identified after an account has been approved and published.
If an error is identified after an account has been published, the following process will apply:
- Consistent with the Bureau of Meteorology’s National Water Accounting Standards, the incorrect table and chart in the account will not be changed to the updated data. Instead, a correction will be made to previous year numbers in the subsequent year’s account, and an explanatory note provided.
- If required, a written erratum note may also be added alongside the incorrect table in the prior published Accounts to indicate to users that a correction to this number has been made in a subsequent report. This enables users to seek and use the latest available information in their data analysis.
Uncertainty in water accounting
The Victorian Water Accounts are a wide-ranging report with data points from a variety of information sources. Many of these are directly measured via meters or gauges and have relatively high confidence. Others are modelled or estimated, and we may have lower confidence in these values. The figures provided in the Accounts represent the best estimates based on the data and models available at the time. Models and methods are periodically reviewed and updated to improve confidence.
Users should note that higher uncertainty exists in the following figures and circumstances in particular:
- Water harvested, used and lost by small catchment dams (farm dams) - these figures are modelled, considering the climate of the year, but the way farm dams impact on the water balance is complex and uncertain due to the influence of numerous variables, including cropping area, crop pattern and irrigator behaviour. The method used in the Accounts also makes assumptions to differentiate between small catchment dams for commercial or irrigation applications, and those used for stock and domestic purposes.
- In-stream infiltration to groundwater, flows to floodplain and evaporation: this loss figure is modelled for some river basins where an appropriate model is available, but its ability to accurately represent overbank and floodplain inundation dynamics is limited. Additionally, surface water-groundwater interactions represent one of the most complex hydrological processes to model. Even sophisticated models may struggle to accurately capture the intricacies of this relationship, leading to inherent uncertainties in the results.
- Streamflow, during high flow events: when flows in waterways exceed the rating curves used to convert stream depth to flow volume, uncertainty increases. Established methods can be used to estimate flows using other available data, but during significant floods it can be challenging to confidently estimate flows. This also impacts the losses and end of basin outflows in the water balance.
- Catchment inflow: in all basins except for the Murray, catchment inflow is the balancing item in the water balance. This means that any uncertainty in any other water balance items will also be reflected in this figure. Catchment inflow is also reported as total streamflow and total available water for surface water systems.
While volumes in the Accounts are presented to the nearest megalitre or gigalitre, these values should be interpreted in the context of the above uncertainty caveats.
Some volumes are unable to be estimated at all, and are not included in the Accounts. Examples include:
- unlicensed diversions for domestic and stock use
- rainfall and evaporation from some storages where suitable nearby gauging sites are unavailable.
How we account for surface water
The basin water accounts track surface water when it:
- appears as inflows to a river or stream
- is diverted or lost from the rivers and streams of the basin
- flows from the basin to another basin
- flows from the basin to the sea
- flows to a terminal lake inside the basin.
Victoria’s river basin boundaries can be seen below. The flow of surface water (and data about the flow) generally aligns well with river basin boundaries, except where water is diverted from a waterway in one river basin and then used in another.
Figure 1: Victorian river basins
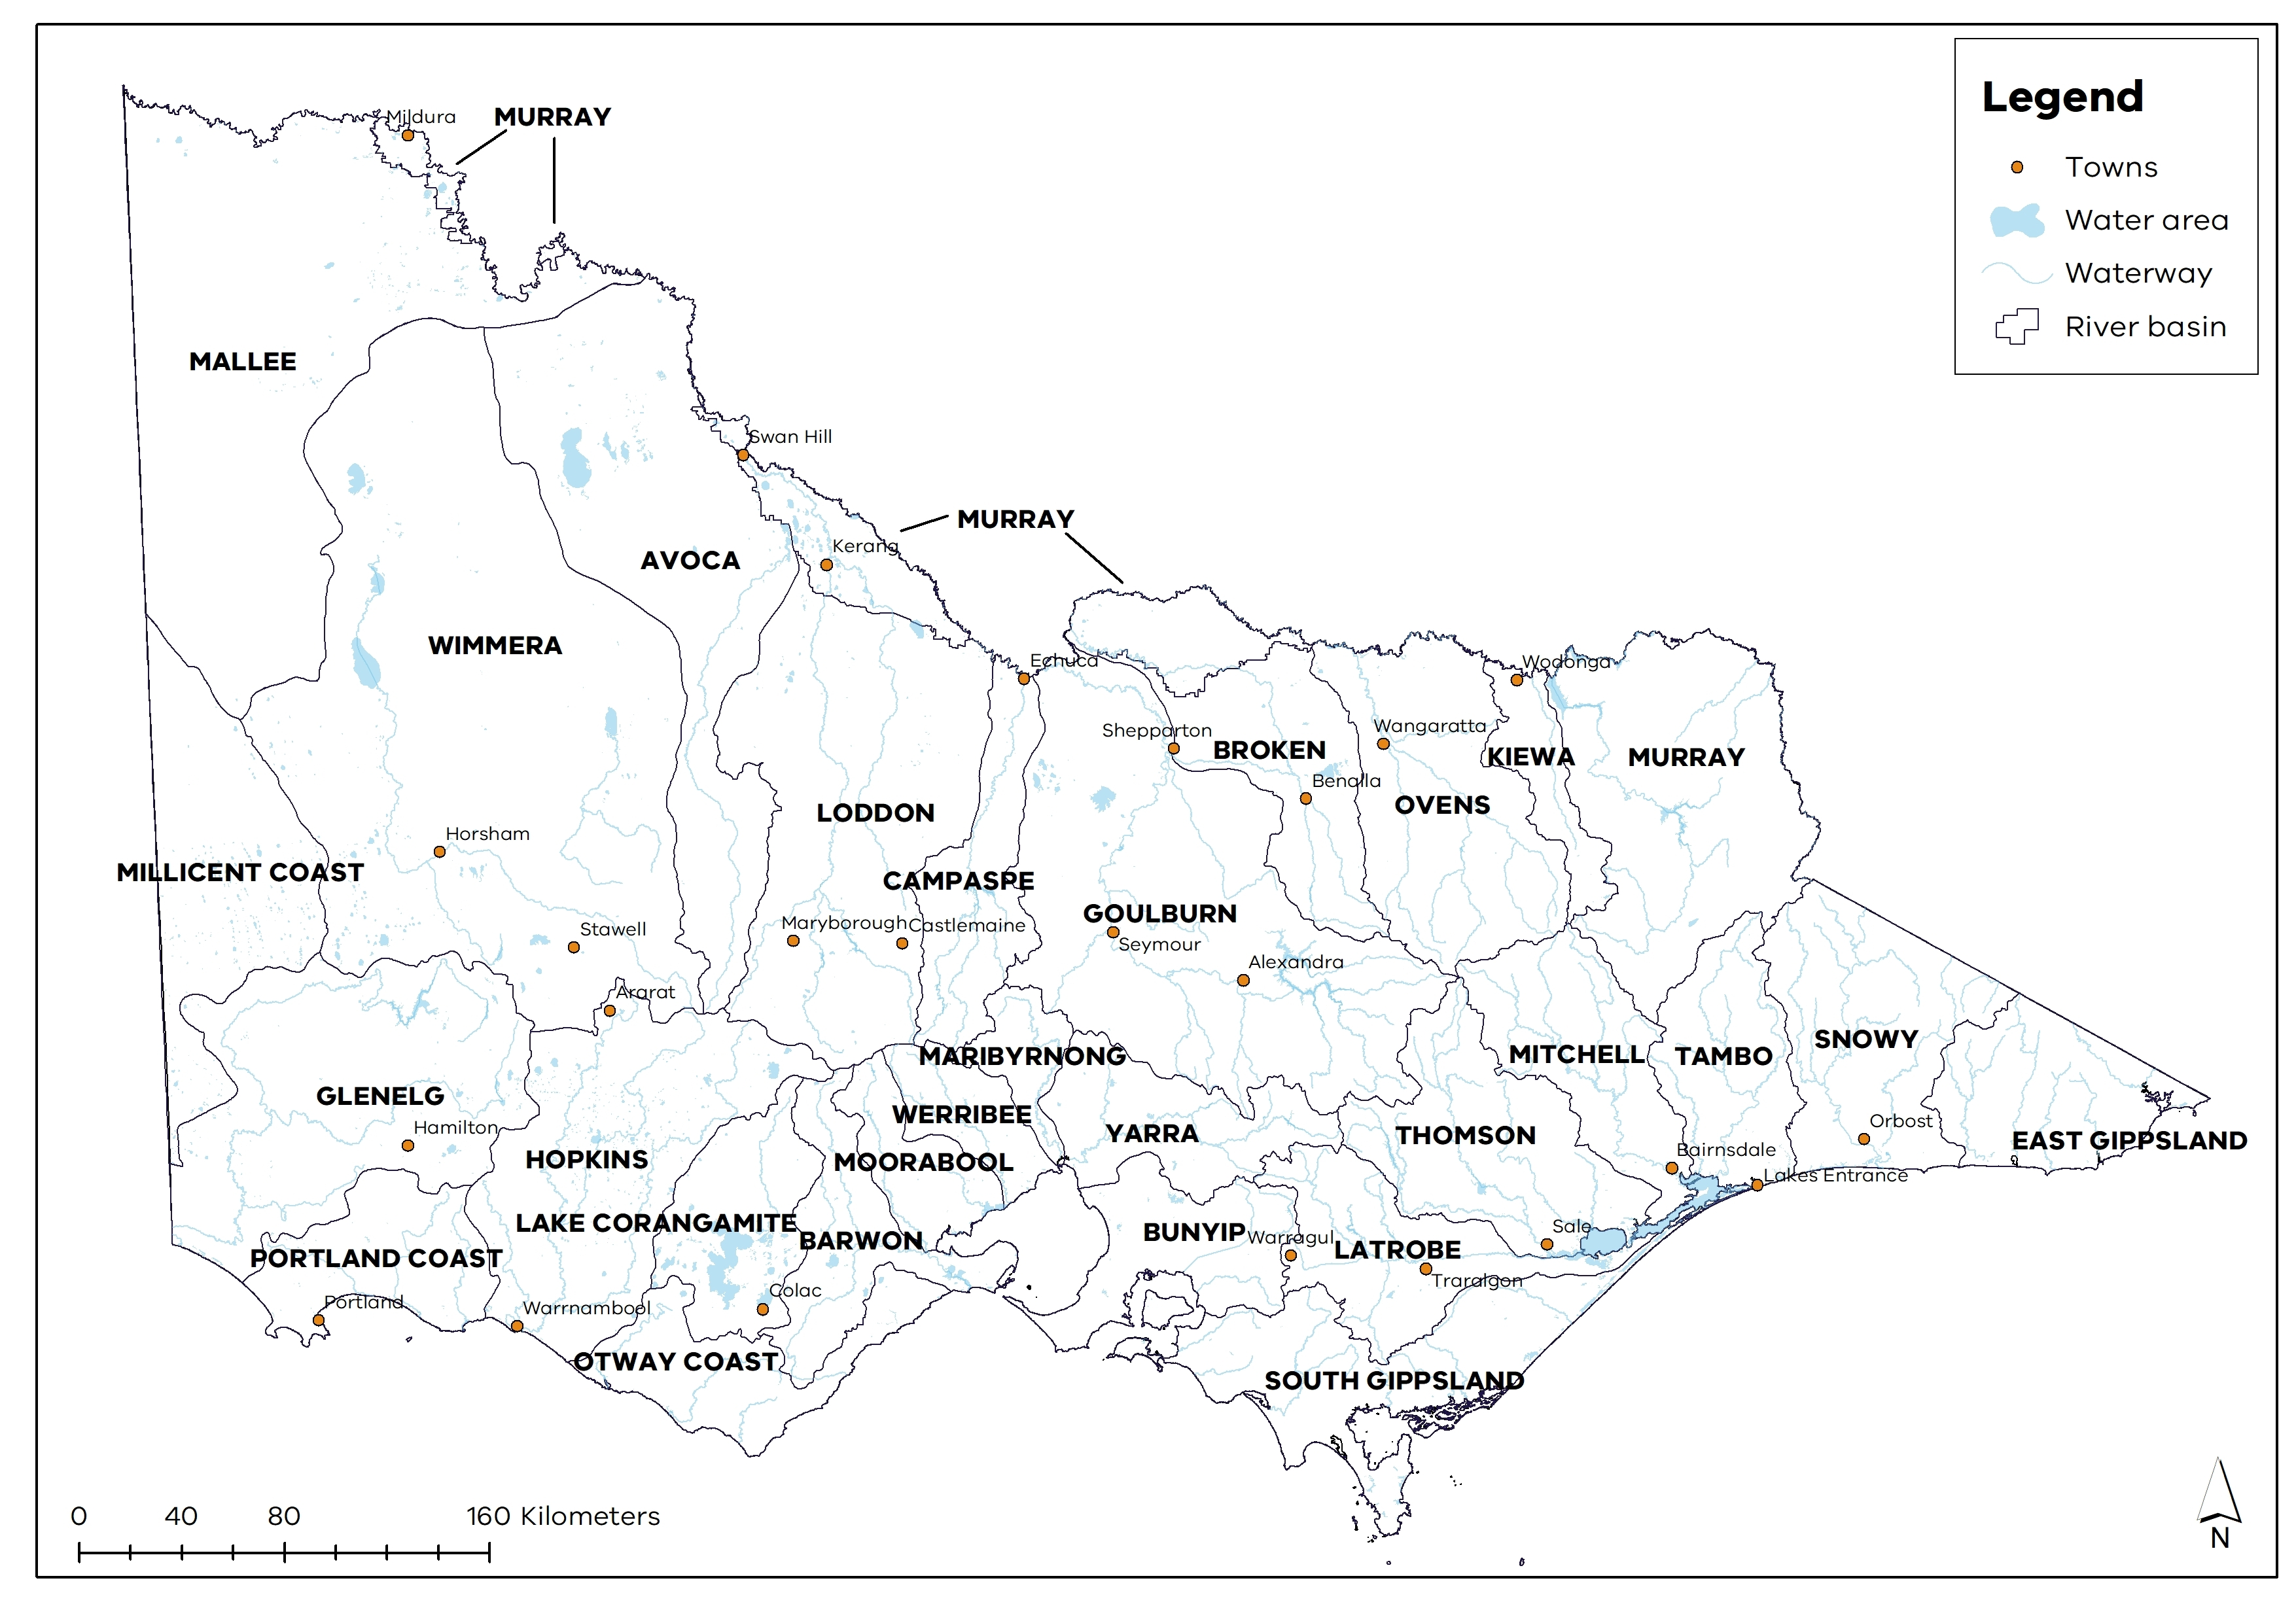
The Victorian Water Accounts use the river basins defined by the former Australian Water Resources Council (AWRC), except for the Murray basin. In the Accounts, the Murray basin includes the Upper Murray basin as defined by the AWRC and the areas in Victoria that are supplied from the Murray River downstream of Lake Hume.
The Victorian Water Accounts report on surface water availability and use at both local (river basin) and statewide scales. The surface water local reports provide the water accounts for Victoria’s 29 river basins for the water year. The Statewide surface water report provides a high-level summary of the data across all basins and provides some additional information that is best reported at a broader scale.
Surface water local reports
Each local report has a brief description of the area and covers the following sections:
- Climate
- River basin water balance
- Entitlements and compliance
- Water for the environment
- Management responsibilities
Climate
This section describes the rainfall received for the water year compared to average rainfall. Average rainfall is calculated using a baseline period from 1975 to the current year.
River basin water balance
The water balance is the principal water accounting tool in the Victorian Water Accounts. It provides a statement of the water flows in a basin for the water year. Here, the sum of the outflows from the basin equals the sum of the inflows, minus the water accumulated in the area.
A water balance is not presented for the Mallee and Millicent Coast basins, as a lack of significant surface water resources in these basins means there is insufficient data available to prepare a water balance. In the northern basins, it is possible that the volumes presented in the water balance are not consistent with the MDBA’s cap compliance reporting due to different accounting methods.
Some explanations and assumptions about components of the water balance are provided below.
Storages
Change in storage is calculated as the difference between the volume in storage at the start of the year and at the end of the year.
Rainfall on, and evaporation from, major storages are reported as inflows and outflows respectively. These are estimated based on local rainfall and evaporation data, and the surface area of the storages.
Change in storage during the year (excluding that from rainfall and evaporation) is measured through catchment inflow less regulated releases. It can be negative if the storage is drawn down during the year.
In general, only on-stream storages with a total capacity of more than 1,000 ML are included in the water balance. Smaller storages are important locally, but generally not material to the total volume of water at a basin scale.
The volume of water in off-stream storages is not reported in the surface water balance. In some instances, this would result in double-counting water that has been diverted from rivers or extracted from groundwater.
Inflows
Catchment inflow
Catchment inflow represents the total volume of surface run-off from rainfall that becomes streamflow in the basin or is captured by small catchment dams.
Generally, a large portion of catchment inflow is the unaccounted-for item in the water balance. As a balancing item, it is calculated as the difference between the total outflows and the known inflows of the river system.
The exception to this is the Murray basin, where catchment inflows are known; they include measured inflows from other river basins and to Victoria’s share of major Murray storages. In the Murray basin water balance, the balancing item is in-stream losses.
The volume of catchment inflow per basin also includes an estimate of the volume harvested by small catchment dams. See below for the small catchment dam accounting method.
Catchment inflows from the water balance are compared to the long-term average inflow for each basin. For the 2023-24 Accounts, the estimates of long-term water availability, also known as long-term average (LTA) inflows, were updated for the first time since the 2018-19 Accounts. The update completed in 2025 for the 2023-24 Accounts used an additional 5 years of data to better represent the current climate (1975 to 2024). See the box below for more detail on this update.
2023-24 update of long-term average inflows
In 2025, a review of the long-term average (LTA) inflows was undertaken to assess the best approach to calculating long-term average and obtain an updated average for each basin. Previously, an estimate of LTA inflows in the Accounts had been calculated using modelled data from the Long-Term Water Resource Assessment (LTWRA), covering the period July 1975 to June 2017. For this review, the previous LTA estimates were compared with an estimate derived from the Victorian Water Accounts-estimated inflows of the previous 19 years (July 2005 to June 2024).
In this comparison, the LTWRA-derived estimates were adjusted to allow for impacts of small catchment dams which were accounted for in the Accounts but not in the LTWRA, and also (where needed) were multiplied by a factor to account for any differences in the area of each basin as defined in the LTWRA and the Accounts. This difference was most prominent in the Corangamite basin which was defined differently between the two studies.
When compared, the two datasets were similar or identical on an annual time step for most basins.
To update the LTA for most basins, the estimates of LTA inflows used in the Accounts were updated by making best use of both the LTWRA dataset and inflows in the historical Accounts. This was done by appending the annual inflow from each year’s Accounts from July 2017 onwards to the LTWRA dataset and re-calculating the average annual inflow to each river basin. This has resulted in a longer dataset (49 years from July 1975 to June 2024) that generates a long-term average that is more robust with respect to climate variability.
There were three exceptions to this approach, in the Snowy, Bunyip and Corangamite basins.
Snowy and Bunyip basins
For the Snowy and Bunyip basins, there were prior errors identified in the outflow models that have been corrected for 2023-24. However, these errors mean that previous VWA inflow estimates are likely overestimated. Consideration was given to scaling the previous estimates of VWA inflows for the Snowy and Bunyip basins to match LTWRA inflow estimates in the overlapping period with the VWA inflows, but a simple factor that achieved a good match in low and high inflow years could not be found. Therefore, the LTA inflow estimate for the Snowy and Bunyip basins was not updated. The review recommended that the existing LTA inflow estimates for the Bunyip and Snowy basins be retained until the LTWRA for southern Victoria is next updated.
Corangamite basin
For the Corangamite basin, there was a large mismatch between the LTWRA and VWA inflow estimates. This was hypothesised to be because the factor used to reflect the different areas covered by the LTWRA and VWA does not accurately represent potentially different rainfall-runoff characteristics across the basin.
So, to update and correct the Corangamite basin LTA estimate for 2023-24 VWA:
- the VWA inflows available for the last 19 years were correlated with the annual inflow in Pirron Yallock Creek at Pirron Yallock (gauge 234203)
- a linear regression between the annual streamflow at the Pirron Yallock Creek gauge and the VWA basin inflows was used to estimate basin inflows from 1975-76 to 2003-04
- the correlated basin inflows for the last 19 years were then combined with the 1975-76 to 2003-04 inflows that were estimated using the linear regression to calculate an updated LTA inflow.
This process of adding extra years of Accounts inflow estimates and re-calculating the LTA inflow for each basin is intended to be repeated every few years, or as needed after a particularly wet or dry year.
Transfers from other basins
Transfers from other basins are included in a basin’s water balance only if they are known to affect streamflows in the receiving basin.
If water transferred across basin boundaries is supplied directly into a water supply system and does not affect streamflows, it is considered as a diversion to an end use (for example, urban and irrigation district diversions). It is not accounted for as a transfer in the water balance.
Return flow from irrigation, environment, power stations or major industry
Return flows represent an inflow to the water balance where water is returned to the waterway after previously being diverted. These can be returned following different uses of water and are specified as such in the water balance line items. Return flows from irrigation are the outfalls from an irrigation system that return to waterways, while return flows from environment represent water returned after off-stream (e.g. wetland) environmental watering events. In the Latrobe basin, return flows are from power stations and major industry.
Treated wastewater discharged back to river
This item represents the volume of treated wastewater discharged from wastewater treatment plants back into waterways.
Volumes of wastewater produced, recycled for various uses and discharged to various receiving environments are provided per wastewater treatment plant in the local water supply reports.
Outflows
Urban diversions and irrigation district diversions
These items represent the total volume of water diverted from waterways by water corporations to supply urban customers, and customers in declared irrigation districts, respectively.
For river basin water balances, water is accounted for at the point of diversion from the waterway and not at the point of use. For example, information about diversions to supply the Rochester Irrigation Area, located at the downstream end of the Campaspe basin, is accounted for in the Goulburn basin, where the source of the supply is located.
Licensed diversions from regulated or unregulated streams
This item represents the volume of water diverted directly from waterways by licence holders. These diversions are reported separately for regulated and unregulated waterways or sections of waterway. Depending on the system, licensed diversions from regulated streams might be either licensed use via a water use licence in declared systems, or a take and use licence in non-declared regulated systems.
Licensed domestic and stock water users are assumed to have diverted their full entitlement volume unless otherwise reported by water corporations.
The water balance excludes diversions under private rights for domestic and stock use (under section 8 of the Water Act 1989), which do not require a licence. The volume associated with these rights is relatively small.
Environmental water diversions
This describes where environmental water is diverted from a waterway to off-stream wetlands or to a distributary river or creek (i.e. where the water does not return to the main river channel) under environmental entitlements. It does not include water use under environmental entitlements that was delivered in-stream – that volume is captured in water passed at outlet of basin (explained below).
Small catchment dam use
This item represents the estimated volume of extractions from small catchment dams within a basin (see below for small catchment dam accounting methodology).
Net evaporation from small catchment dams
This item is the total estimated volume of evaporation minus direct rainfall from all small catchment dams’ surfaces.
In-stream infiltration to groundwater, flows to floodplain and evaporation (in-stream losses)
This item, commonly referred to as losses, represents the volume of water that is lost from the waterway via natural processes and is not directly measurable. These losses are typically modelled (where models exist) as a proportion or function of gauged streamflow.
In the Murray basin, in-stream losses for the year are not accounted for and are used as balancing items. In this instance, in-stream losses are determined to be the difference between the known outflows and the total inflows plus the net change in storage volume.
There are 12 basins (East Gippsland, Snowy, Tambo, Latrobe, South Gippsland, Yarra, Corangamite, Otway Coast, Hopkins, Mallee, Millicent Coast and Portland Coast) where a suitable loss model does not exist. In these basins, in-stream losses are not included in the water balance.
For the remaining 16 basins, losses are estimated using a simple model that is derived from the loss functions in water resource models. These loss models were reviewed and updated in 2025, reflecting newly available water resource models for those basins. Table 1 below lists the water resource models used to develop the simple loss models. More information on the update process can be found in the box below.
Models used to derive in-stream losses
Table 1: Current and updated models used to estimate in-stream losses
| Basin | Previous model(s) used | Updated model(s) used for 2023-24 and subsequent accounts |
|---|---|---|
| Kiewa |
|
|
| Wimmera |
|
|
| Mitchell |
|
|
| Thomson |
|
|
| Bunyip |
|
|
| Maribyrnong |
|
|
| Werribee |
|
|
| Moorabool, Barwon |
|
|
| Glenelg |
|
|
| Loddon |
|
|
| Ovens |
|
|
| Broken, Goulburn & Campaspe |
|
|
| Avoca |
|
|
Note: REALM is an acronym for Resource Allocation Model.
2023-24 update of river basin loss models
In 2025, the models used to estimate in-stream losses in many basins were reviewed. As shown in Table 1, many of the REALM models on which the loss models were based had been superseded by Source models. There had also been changes in the streamflow gauge network in the approximately 6 years since the previous review. Loss models for the Goulburn, Broken, Campaspe and part of the Loddon basin were excluded from this review, as those models are estimated directly using a Source model run by DEECA’s modelling team.
To update the loss calculations for these 10 basins:
- the available Source models were run for their full period of record under historic climate conditions, and annual (July to June) losses and flow at active gauges were extracted
- linear regressions were then fitted to these datasets, and used to estimate annual loss given recorded annual flow.
- 11 basins were updated to Source from REALM (Bunyip, Barwon, Moorabool, Thomson, Mitchell, Maribyrnong, Werribee, Glenelg, Wimmera, Kiewa and Ovens):
- 10 of these needed to have linear regressions fitted to the datasets as the loss functions in the Source models were based on streamflow simulated at locations where the gauges are now inactive.
- Bunyip basin did not need linear regression because Source model losses can be directly applied to recorded data (the gauge remains active).
- For the Avoca basin, there is no Source model available so the REALM-based model was reviewed and minor changes made.
- A minor change was made to the Loddon basin Loddon REALM model (downstream of Loddon Weir).
- The loss estimates have generally increased, and the changes in percentage terms are sometimes quite high. However, this is not unexpected given that many of the losses previously derived using functions in REALM models are now estimated using outputs from Source models. Source models have been developed to run on a daily time-step and consider losses during low and high flow periods, whereas many of the REALM models had weekly or monthly time-steps and loss functions for only low flow periods.
- For example, in the Mitchell basin, the new loss model provides a significantly higher resulting loss estimate. The previous model would have estimated the losses in 2023-24 to be 0 ML, but the new loss model provides an estimate of 94,400 ML. This is because the previous model only generated an estimate for losses when the weekly flow volumes on the Wonnangatta and Mitchell Rivers were very low; otherwise losses were reported as zero. The new model estimates losses for a greater range of low and high flows and has been developed to run on a daily time-step. In the Mitchell basin, there were significant losses at some locations even during high flows up to 3,000 ML per day; these losses would not have been included in the previous model.
- It is not possible to measure actual losses at a basin scale. However, the updated loss estimates are an improvement compared with previous estimates because they account for losses across a broader flow range. In addition, the Source models have been developed more recently compared with the REALM models, and are therefore calibrated to longer periods of streamflow and demand records. And although loss estimates remain a source of uncertainty in the VWA water balances, the loss terms are relatively small compared to other items such as inflows and outflows.
Water passed at outlet of basin
This item represents the total volume of water that flows out at the end of the basin, either to the ocean, other rivers, terminal lakes or, in the case of the Murray, Victoria’s share of flows crossing the South Australian border. North of the Great Dividing Range, gauged flow is used as recorded. South of the Great Dividing Range, gauged flow is scaled to account for the area downstream of the gauge, and contributions from ungauged sub-catchments discharging to the ocean independently from the main river within each basin are also included in the outflow calculations.
In 2025, a review was completed to determine whether any changes to the calculations were required or whether there were any newer or more appropriate gauges that should be used. Changes to the gauged streamflow data and calculation methods were recommended and implemented in 12 basins. See the box below for more detail on this update.
2023-24 update of basin outflow estimate models
In 2025, the model that is used to estimate outflow from each basin was reviewed. This review sought to identify whether changes in the gauge network since the previous (2019) update enabled any improvements, for example by identifying recently installed gauges located further downstream or in previously ungauged sub-catchments.
The review found that:
- based on Victoria’s current streamflow monitoring network, there were 7 suitable gauges located downstream of the gauges previously used in the Accounts, and 4 suitable gauges in previously ungauged sub-catchments that could be included in outflow estimates
- a few small areas of ungauged coastal streams in basins in southern Victoria were not included in previous estimates of outflows
The review also identified some errors in the outflow calculations that had previously been used for the Snowy, Bunyip and Corangamite basins. These were corrected following the review and applied to 2023-24, but not retrospectively applied to water balances in previous years.
Changes to the gauged streamflow data and calculation method were recommended in 12 basins, and implemented for the 2023-24 Accounts.
Small catchment dam accounting method
Small catchment dams harvest water from their local catchment. The presence of small catchment dams changes the hydrology in a basin by reducing the rate of overland flows (that is, surface run-off) and by altering evaporation and groundwater seepage. Small catchment dams reduce the volume of surface run-off that might otherwise become streamflows in a basin. Victoria models the volumes associated with small catchment dams via a small catchment dam interception model.
In the Victorian Water Account before 2016-17, the total volume of water harvested by small catchment dams was estimated from computer-based simulation modelling of the impact of small catchment dams on mean annual streamflows, based on estimates of the total volume of small catchment dams in a basin.
From 2017-18, the method used to estimate the usage, evaporation and harvested volumes from small catchment dams was improved. The key difference is that each dam identified in the geographic information system data has been individually modelled, to better reflect the water balance around the dam based on the climate for that year.
Volume harvested by small catchment dams
The amount is determined by calculating the water balance around each individual dam based on the annual climate including inflows, extractions, rainfall and evaporation. The total volume harvested is the difference between dam inflows and outflows. By aggregating volumes harvested by dams across each basin, we estimate how much water is harvested by small catchments over the course of the year.
Use by small catchment dams
The volume extracted — the volume used in each basin — is calculated by multiplying the estimated capacity of each dam by an extraction factor and reducing this number as necessary if the dam had insufficient inflows to supply the volume required.
Net evaporation from small catchment dams
This volume is determined directly from a water balance calculated for each individual dam.
When rainfall is high and evaporation is low, this can be represented as a loss with a negative value in the water balance.
Entitlements and compliance
This section presents the entitlement volumes, available water and compliance against entitlements in the basin for the water year.
Entitlement volumes
A table in each surface water local report shows the volume of entitlements as of 30 June for each water year.
Entitlements provide the basis for how water is shared. The total volume of entitlements changes each year as new entitlements are issued, or existing entitlements are modified. The total entitlement volume presented in these Accounts is the maximum amount that can be taken in any one year. The volume available in a particular year is dependent on the rules for allocating water set out in the entitlement and the seasonal conditions in that year, which can vary. Some entitlements, often held by the environment and water authorities, do not have a specified annual volume. Those entitlements still provide for a share of the resource; however, the Accounts do not report a volume for them.
Bulk entitlements specify a maximum volume of water that may be diverted over a given number of years. The annual entitlement volumes table provides the entitlement volume at the end of the water year and represents the maximum volume that may be diverted in any one year. Where the entitlement volume is an amount specified over more than one year, the total volume that may be taken over the period of the entitlement is shown in the notes. For example, the Gisborne-Barringo Creek bulk entitlement in the Maribyrnong basin specifies that up to 585 ML can be diverted in any one year, while the maximum volume that can be taken over any 5-year period is 1,600 ML (320 ML annual average).
In the large, regulated systems, bulk entitlements are normally specified in one of 2 ways:
- source bulk entitlement: this is an entitlement to harvest water directly from a water source. Source entitlements typically cover multiple storages operated in an integrated way within a river basin. They also include obligations to divert or release water to supply primary entitlement holders (such as customers within irrigation districts, licensed diverters in regulated streams, water corporations that hold delivery bulk entitlements and environmental entitlements held by the VEWH).
- delivery bulk entitlement: this is an entitlement to be supplied with water from another water corporation’s dam within a water supply system that is regulated by the works of another water corporation.
The bulk entitlement volume for a source bulk entitlement will include the volumes supplied to delivery bulk entitlement holders and other primary entitlement holders specified in the source bulk entitlement. To account for this, primary entitlements are presented inset as a part of the source bulk entitlement.
Entitlements to water also include rights granted to individuals (for example, water shares and take and use licences). These are reported as a group of each entitlement type and show the total volume of licences issued per basin.
Unregulated licences have been reported separately and include:
- take and use licences – unregulated surface water, which includes all licence volume for water taken from the waterway. It includes licences that take from a waterway to fill an off-water dam (a dam that cannot harvest from the catchment)
- licensed small catchment dams – on-waterway, which harvest water from the catchment and do not take any water from the waterway.
Note that the volume of usage, loss and water harvested for small catchment dams is an estimate based on a small catchment dam interception model.
Available water and take under entitlements
A table in each surface water local report shows the volume of water made available and taken under entitlements for each water year.
The components of the available water and use table – opening carryover, allocation issued, net trade in or out, spillable write-off, total water available and water taken – are described below.
Opening carryover: this item represents any water carried over from the previous water year that was available for use.
Allocation issued: this item represents the water allocation made available under the entitlement in the water year. Individuals or authorities that hold water entitlements in Victoria are allocated water according to the volume and reliability of their entitlement and the available resource. For example, if entitlement holders with low-reliability water shares in the Thomson-Macalister system are allocated 25% of their entitlement, they will be allocated 25 ML for every 100 ML of low-reliability entitlement they own. This is available to use or trade.
Water issued and used under take and use licences is also represented as allocation in the allocation account balance tables. This allocation issued represents the volume that was available under licences throughout the water year. At a system level, that volume can be different to the entitlement volume at the end of the water year. Where licences have been cancelled during the year, the allocation volume presented may be greater than the entitlement volume at the end of the water year.
The volumes may also be different because of temporary trading between systems. For example, in the Ovens basin, temporary trade of licences can occur between unregulated and groundwater systems, which would affect the allocation volume issued to licences in the Ovens basin.
Net trade in or out: this item represents the volume of water traded into the basin, less the volume traded out of the basin.
Spillable write-off: in the Murray, Goulburn, Campaspe and Wimmera basins, some of the water volume carried over from the previous year can be deducted from customer accounts if major storages spill (overflow).
Total water available: this represents the volume of water that was available for use and trade in the water year. This item is the sum of opening carryover, allocation issued and the net of the in or out trade of water, less the spillable write-off.
Water taken: this item represents the volume of water used during the year under the entitlement. Where a source bulk entitlement exists, a total diversion is reported. This represents the volume of water diverted from the waterway to supply the primary entitlements specified in the bulk entitlement.
Compliance
The Victorian Water Accounts report entitlement compliance only at a whole-of-river-basin, rather than against individual entitlements.
Most extractions are metered. For more information about Victoria’s metering program, go to Keeping track of Victoria's water.
Compliance against water entitlements is reported in these Accounts in 3 areas:
- entitlement issued: that the volume of entitlements issued in a basin does not exceed formal caps or has not increased without appropriate approvals
- water taken: that the volume of water taken during the year does not exceed the volume considered to be available for consumptive and/or in-stream use during that year
- bulk entitlement provisions: that holders of entitlements do not breach any provisions that are documented in their bulk entitlement orders.
Water for the environment
This section describes the environmental watering sites in the basin and any environmental entitlements. It also summarises the volume of environmental water delivered for the water year.
Management responsibilities
This section details the relevant organisations in each basin and their management responsibilities.
How we account for groundwater
Through this website, you can view groundwater use and availability via groundwater local reports (select by catchment or management unit) or the Statewide groundwater report.
The groundwater catchment and groundwater management unit (GMU) local reports are similar in nature.
Both types of groundwater local reports include groundwater level trends, summaries of entitlements and use, restrictions on licensed use and management responsibilities.
Groundwater catchment local reports also include a high-level overview, and a summary of rainfall received.
GMU local reports also include compliance against entitlements.
Groundwater catchment local reports
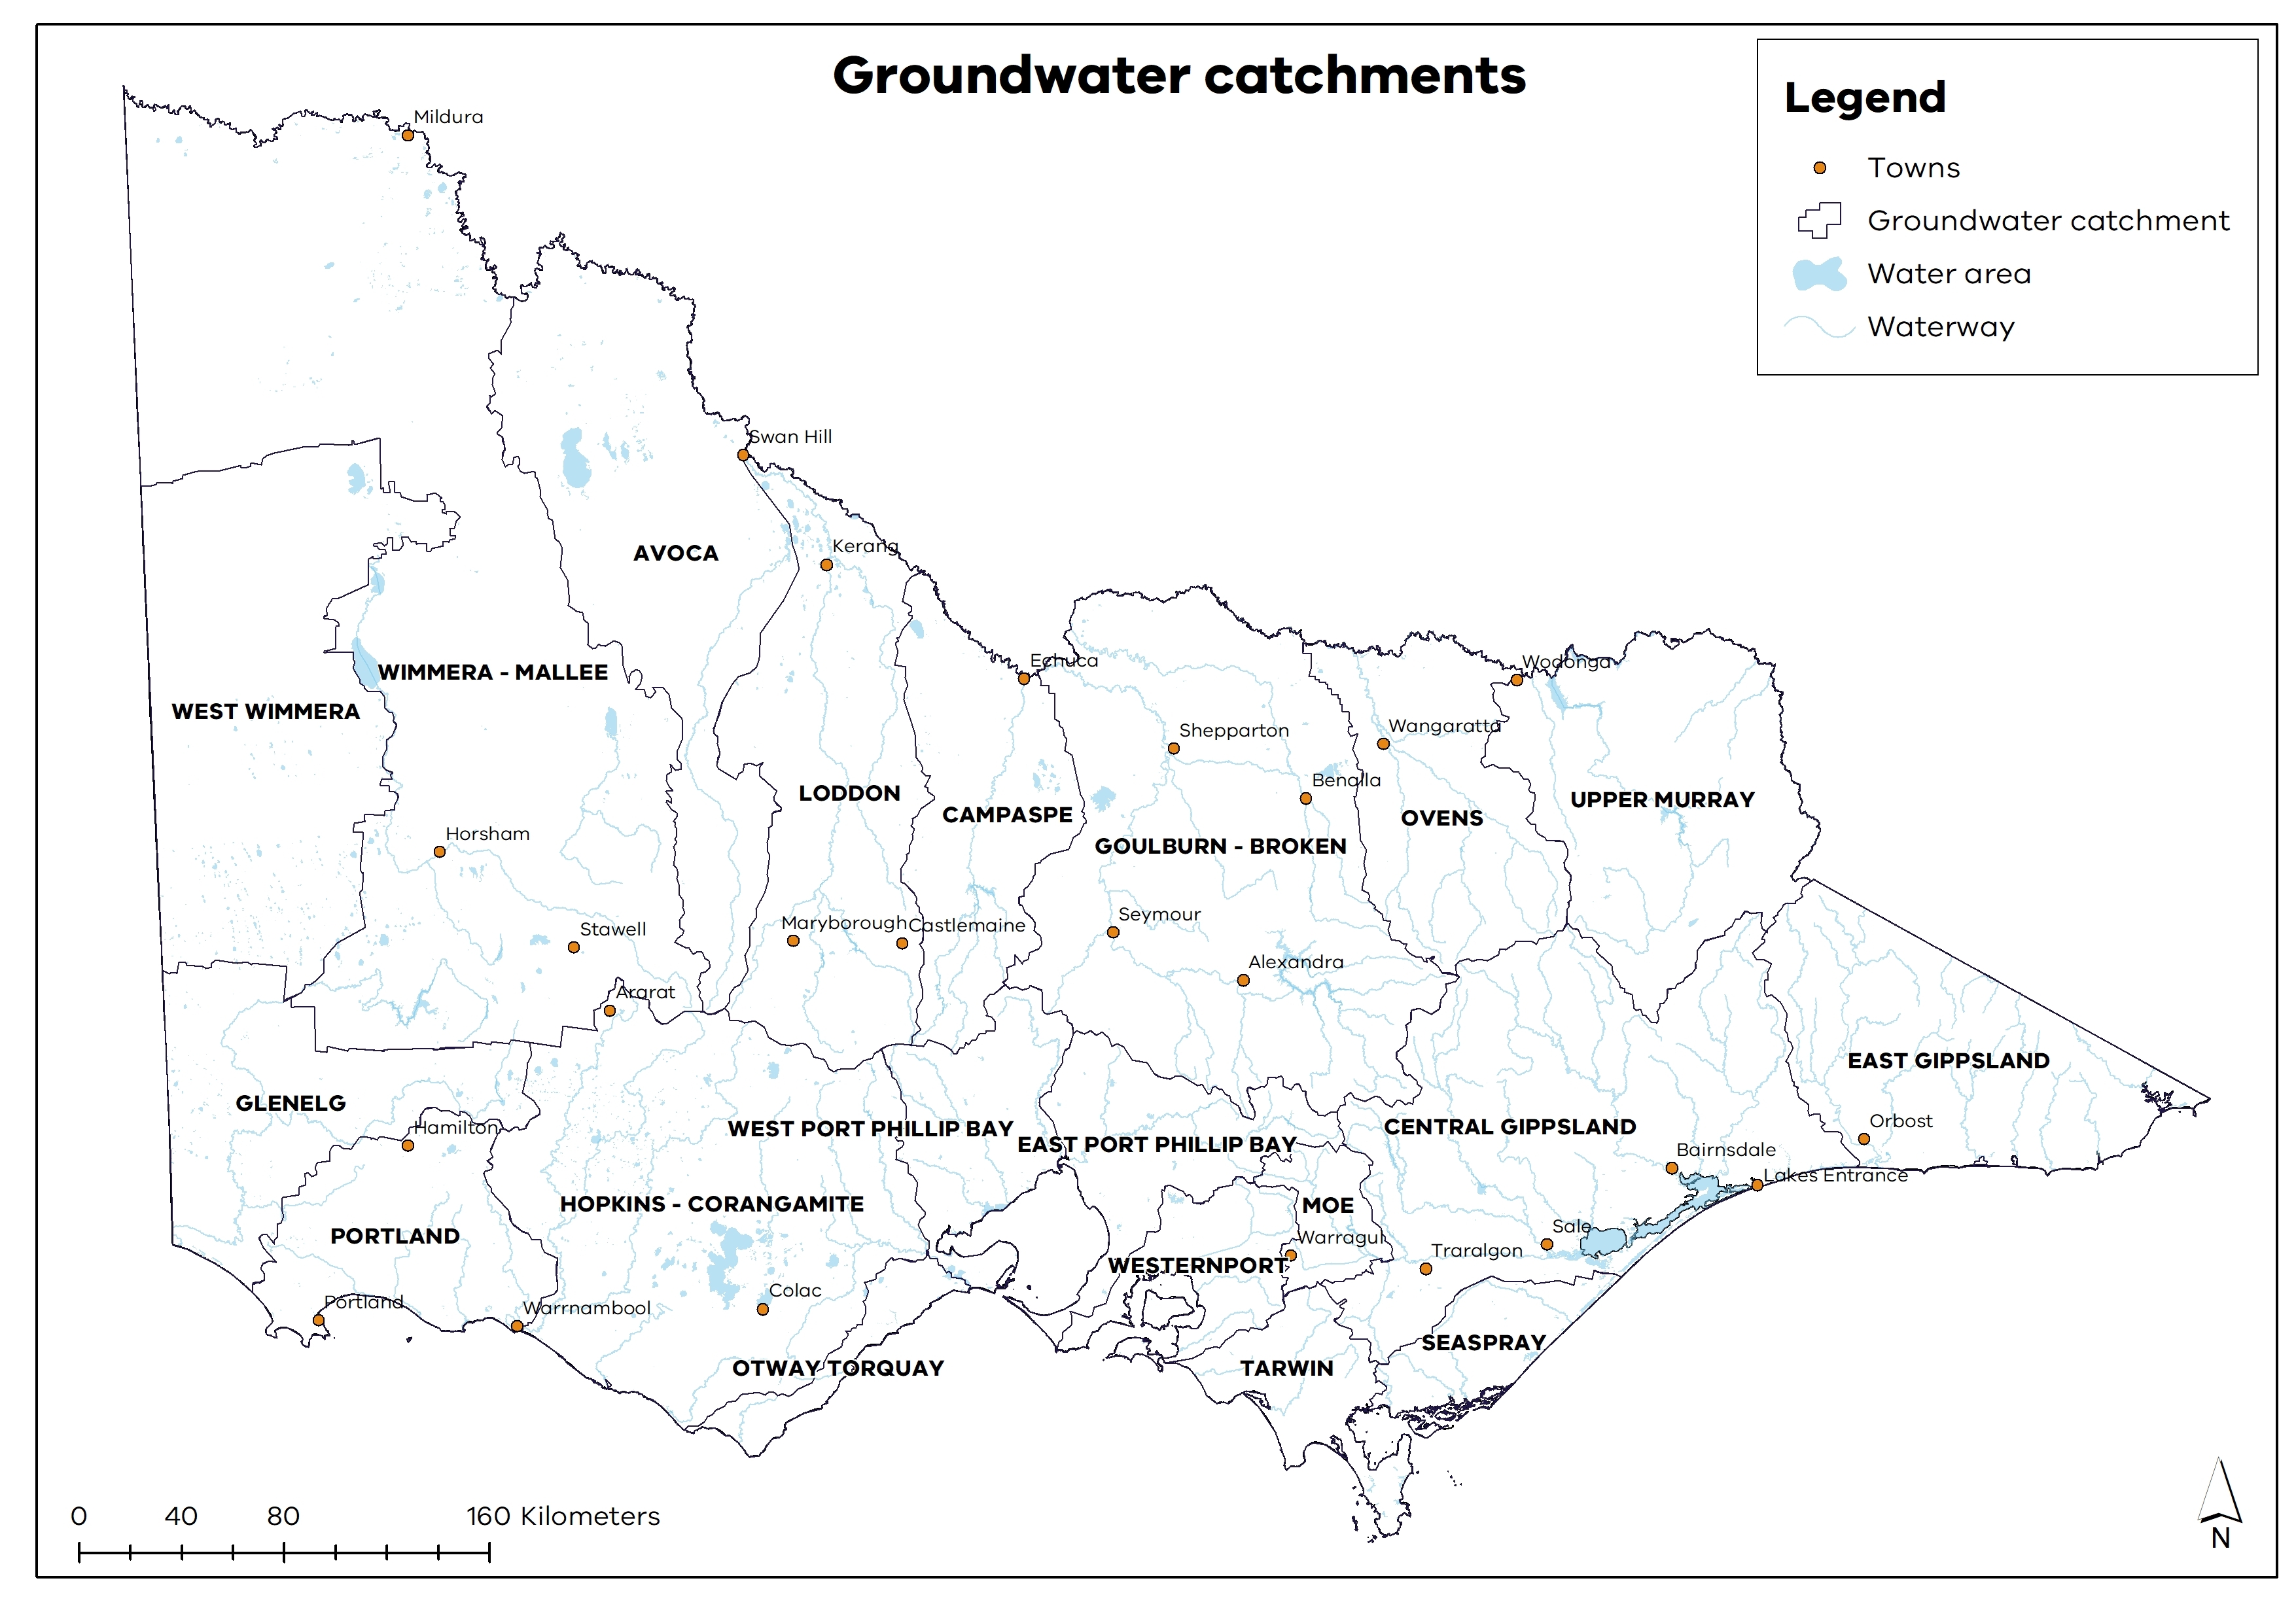
The main way we report on groundwater accounts in the Victorian Water Accounts is by groundwater catchment local reports. There are 20 groundwater catchments in total across Victoria (Figure 2). A groundwater catchment approximates their respective surface water basin, with adjustments based on knowledge and assumptions about groundwater flow divides.
Figure 2: Victorian groundwater catchments
Groundwater management unit local reports
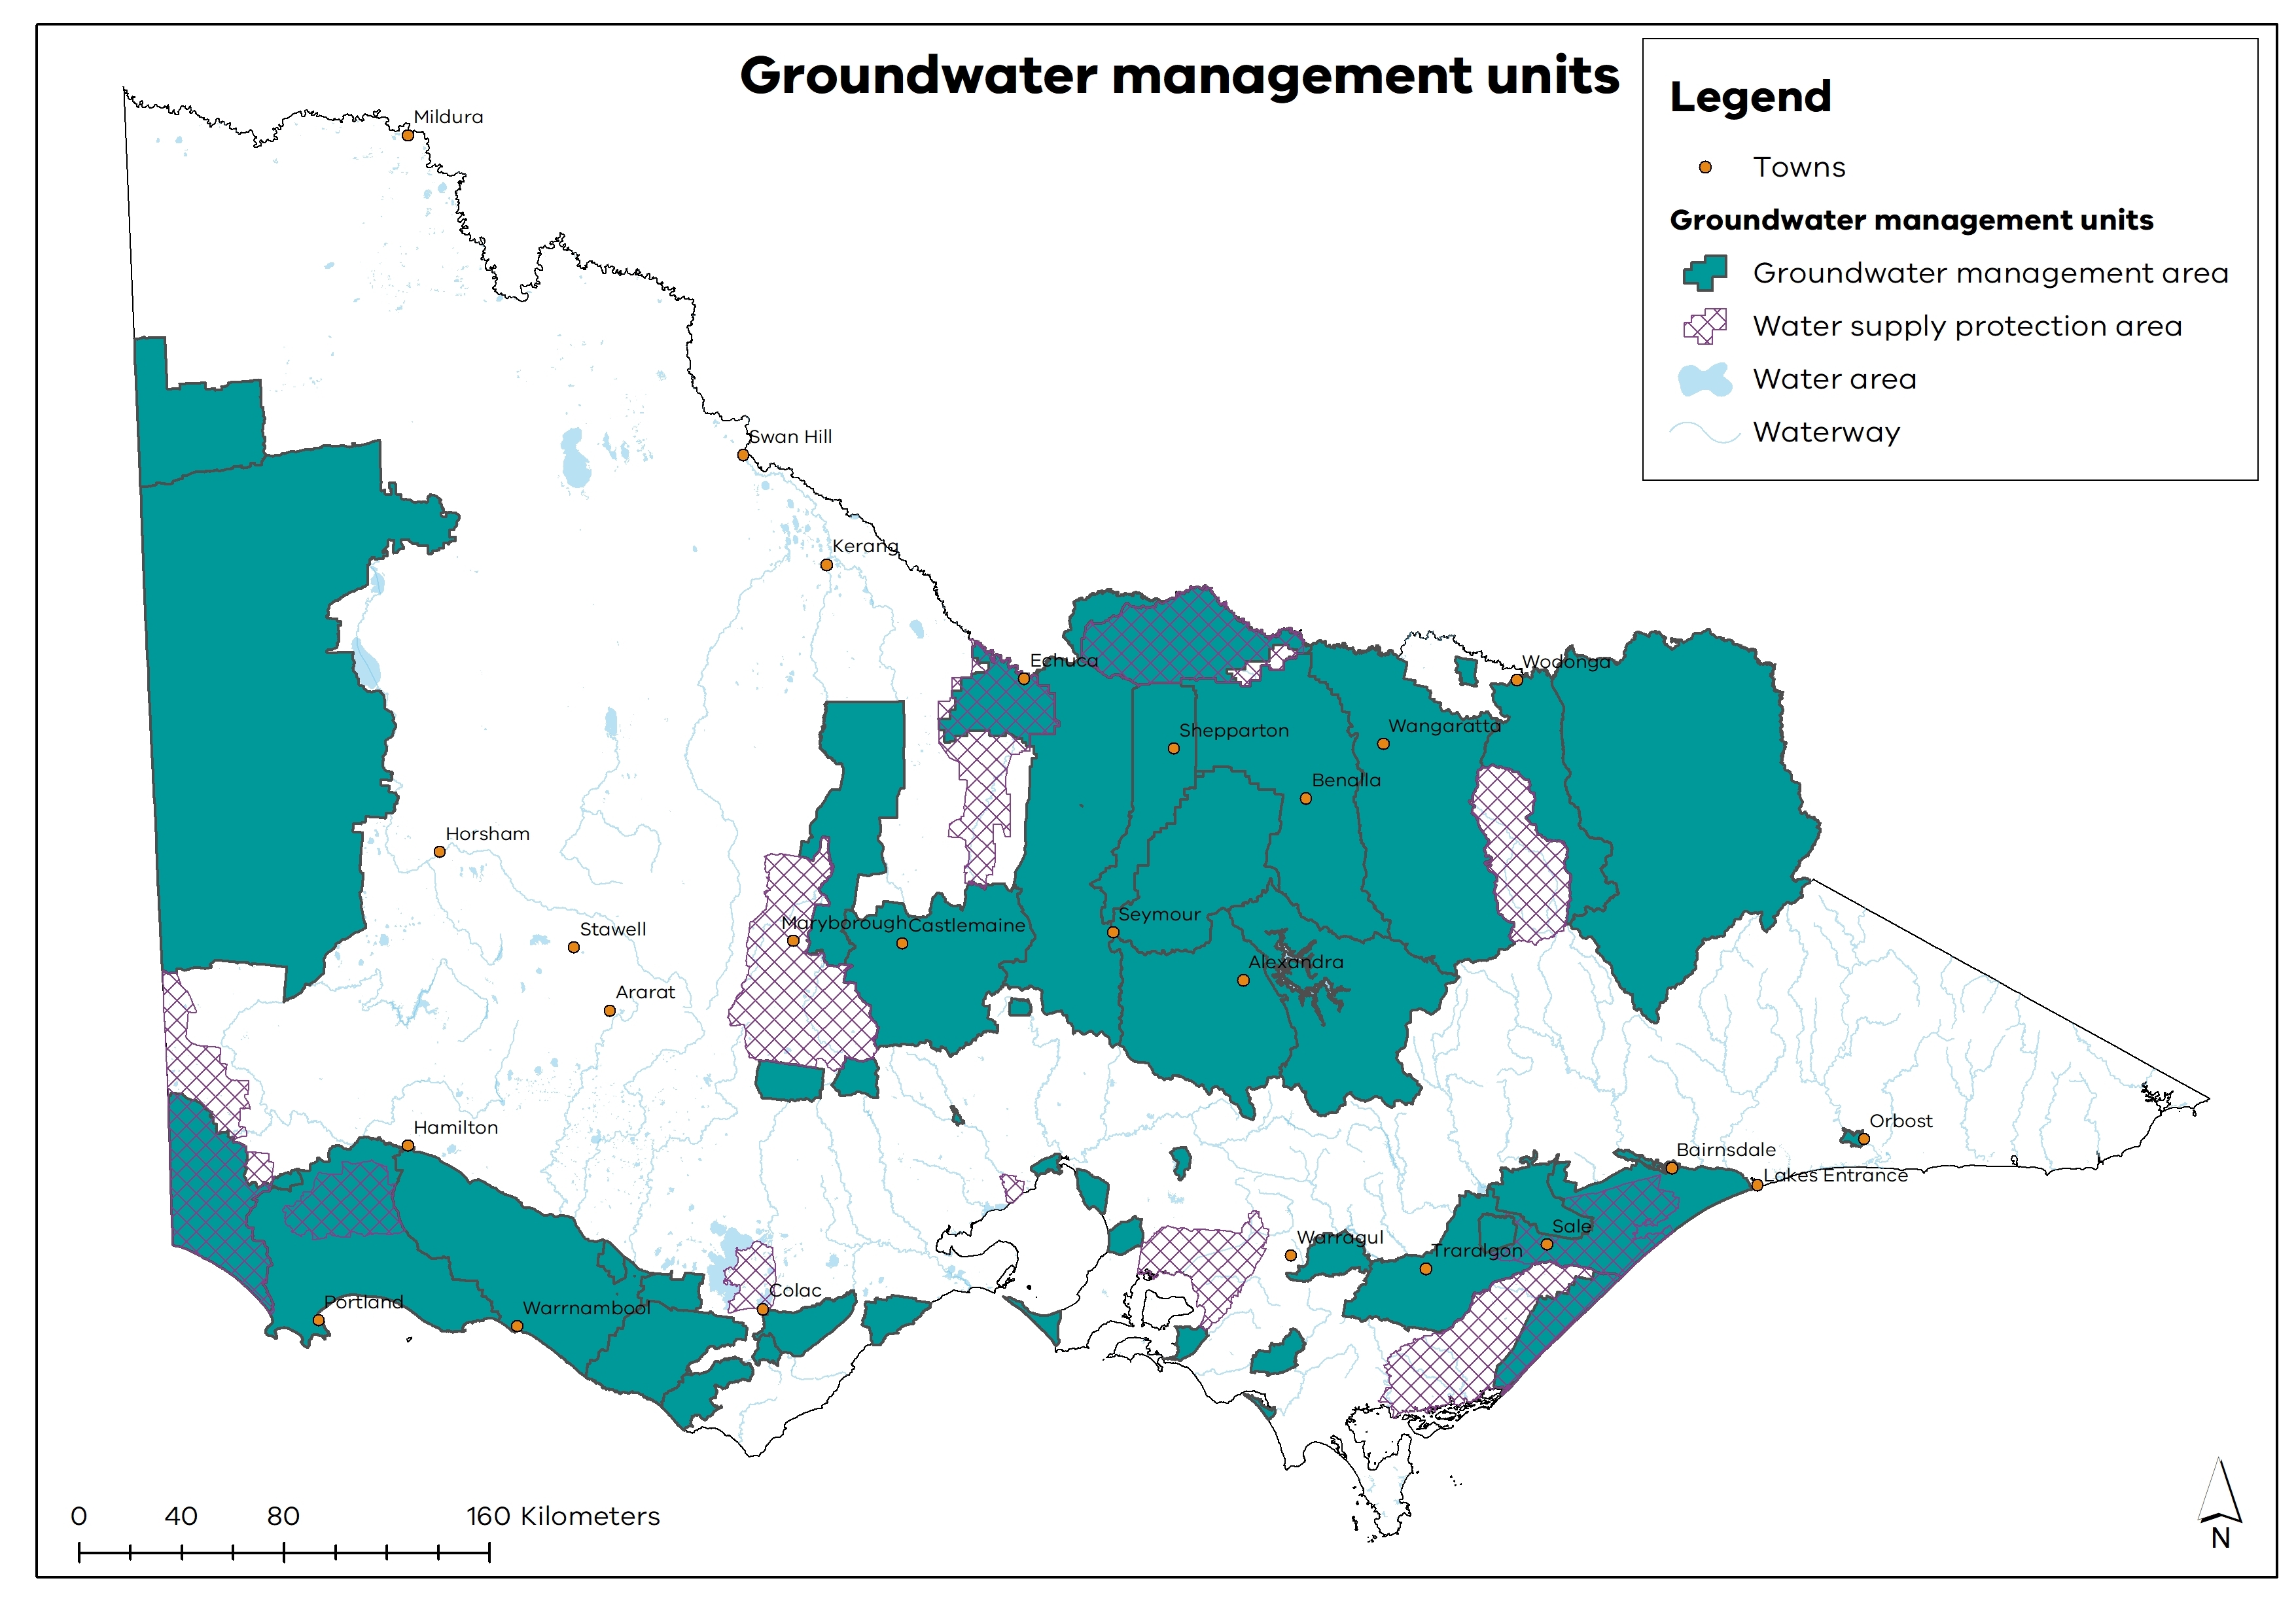
We also provide local report accounts for each groundwater management unit (GMU). GMUs are smaller management units found within groundwater catchments. A groundwater catchment can include several GMUs.
The GMU local reports provide the accounts for Victoria’s 55 groundwater management units (Figure 3).
Figure 3: Victorian groundwater management units
How to read groundwater local reports
Climate
This section describes the rainfall received over the groundwater catchment for the water year, compared to average rainfall. Rainfall can act as recharge for aquifers, where they are connected to the surface.
The baseline period used to calculate average rainfall is 1975 to the current year.
Groundwater level trends
This section summarises 5-year trends in GMUs. Long-term trends in groundwater levels reflect differences between water flowing into (recharge) and out of (discharge) an aquifer and how much is taken for consumptive purposes.
Groundwater level trends in shallow aquifers are more likely to reflect more-rapid changes in annual recharge from either rainfall or discharge from irrigation, whereas confined aquifer trends may show a seasonal influence from pumping within a longer-term trend.
In the Accounts:
- groundwater level trends for GMUs have been determined based on 5 years' consistent monitoring data from key bores in the State Observation Bore Network
- trend determinations are made quarterly, and each reading is compared to previous readings in the same season (that is, a summer record is compared to previous summer records) to account for seasonality
- the reported trend for each quarter represents the change in level in the last 5 years. If the level is similar to 5 years earlier it is called stable, if it is higher or lower it is called rising or declining, respectively
- trends are calculated mathematically using data with variable timescales, and do not necessarily represent the status of the resource for management purposes.
Groundwater restrictions
This summarises any restrictions on licensed groundwater use in GMUs during the year. More general information about restrictions on groundwater licensed diversions is available in Responding to water availability.
Entitlements and use
Groundwater entitlements and use is reported under 5 use types: urban, non-urban, power generation, domestic and stock, and salinity control.
- Urban use represents licences held by urban water corporations to supply towns. These are typically in the form of take and use licences, except for one groundwater bulk entitlement held by Barwon Water in the Otway-Torquay groundwater catchment.
- Non-urban use represents licences held for non-urban uses, including irrigation or commercial uses. Unlike for surface water, groundwater data is unable to distinguish between irrigation and commercial uses, so both are reported together.
- Power generation use represents licences held for the purposes of large-scale power generation.
- Domestic and stock use reports on estimated groundwater use for domestic and stock purposes, which is permitted without a take and use licence under section 8 of the Water Act 1989.
- Salinity control use reports on groundwater taken for the purposes of managing salinity.
Domestic and stock use estimation
Domestic and stock use in each GMU is estimated based on the number of active bores according to the following function:
- In areas managed by Goulburn-Murray Water and Grampians Wimmera Mallee Water, 2 ML usage per bore per year is assumed.
- In the area managed by Southern Rural Water, 1.5 ML usage per bore per year is assumed, except for:
- Nepean GMA, where 1 ML per bore per year is assumed
- Stratford GMA, where 2 ML per bore per year is assumed.
The number of domestic and stock bores recorded for each GMU includes all bores registered in the Water Measurement Information (WMIS) and the Victorian Water that are less than 30 years old. This is the expected lifespan of a bore.
GMUs are assigned domestic and stock bores based on the:
- spatial location
- depth of the bore.
Some water for domestic and stock use is taken under a take and use licence. This is recorded within the licensed entitlement extraction volume and is not reported here.
The Entitlements and use section includes 2 sub-sections: Entitlement volumes and Available water and use.
The Entitlement volumes sub-sectioncontainsa table and a chart outlining the total licensed entitlement volume for urban, non-urban and (where relevant) power generation use types within each GMU as of 30 June for each water year.
The total volume of groundwater entitlements that are outside management units (i.e. not in a GMU) is also shown for groundwater catchments.
The Available water and use sub-section contains a table outlining the following values for licensed use, per use type and per GMU.
- Carryover is any water carried over from the previous year that was available to use. Carryover in a particular system is only available if the Minister for Water has made a declaration under section 62A of the Water Act 1989.
- Licensed volume allocated is the volume of water able to be taken and used under licences during the year. The licensed volume allocated may be different to the licensed entitlement volume because:
- a restriction on water use might be in place in the GMU. For example, to manage the resource, licence holders in a given year might be restricted to a set percentage of their entitlement volume
- licences may have been cancelled or temporarily traded during the year. This means the allocation volume may be greater or less than the entitlement volume. For example, temporary trade of licences can occur between GMUs in Victoria. This would affect the allocation volume issued to licences within those GMUs.
- Net trade is the volume of water traded in for use within the GMU, minus the water traded out of the GMU.
- Total water available is the volume of water that was available under licences to be taken in a given year. This is the sum of 3 components: carryover, water allocated and the net of the in or out trade of water.
- Water taken is the volume of water taken and used during the water year under licences.
Note that total water available is distinct from the permissible consumptive volume (PCV). PCV represents the maximum volume that can be licensed and used in a GMU as declared by the Minister for Water. The total water available represents the overall volume that is available to licence holders in each individual year. The available volume may change from year to year because of carryover and/or trade.
A chart is provided under available water and use sub-section, that shows the breakdown of type of use.
Compliance
Most groundwater extractions in Victoria are metered. The metering of licensed groundwater extraction supports responsible groundwater management. For information about Victoria’s metering program, go to the DEECA Water
In the Accounts, we report groundwater compliance at a whole-of-GMU scale, rather than against individual entitlements. Compliance against water entitlements is reported for GMUs in 2 areas:
- entitlement issued: that the volume of entitlements issued in the GMU does not exceed relevant permissible consumptive volume (PCV) or has not increased without appropriate approvals
- water extracted: that the volume of water taken under entitlements during the year does not exceed the total water available to licence holders.
PCV compliance is not assessed in the following 5 GMUs:
- Upper Ovens WSPA. A PCV is not required because the management plan prevents additional entitlements or an increase in entitlement volume being issued, except by trade
- Shepparton Irrigation Region GMA. There is no PCV as there is no limit on the total volume of shallow groundwater entitlement available
- West Goulburn GMA. There is no PCV, but there are individual zone caps set
- South West Limestone GMA. The PCV has not been gazetted:
- The South West Limestone GMA includes the areas of the former Nullawarre WSPA, Yangery WSPA, Hawkesdale GMA, Heywood GMA and the areas outside the former GMUs but included within the South West Limestone GMA area
- The PCVs for the 4 GMUs have not been revoked and still apply. These are:
- Nullawarre 22,741 ML
- Yangery 14,352 ML
- Hawkesdale 16,161 ML
- Heywood 8,500 ML
- Stratford GMA. Current compliance assessment criteria are not applicable. Licences for coal mines physically in the area are not assigned to the Stratford GMA.
For West Wimmera GMA, Wy Yung GMA, Nepean GMA, Rosedale GMA, Stratford GMA and Wa De Lock GMA, the PCV that applies is the sum of the PCVs for all zones within these GMAs.
How we account for water supply
Water supply local reports provide the accounts for all of Victoria’s rural and urban water supply systems, at both individual system scale and water corporation scale.
In previous Accounts, these were referred to as distribution systems rather than water supply systems. The meaning has not changed.
While surface water and groundwater reports in the Accounts describe the entitlements and use of water taken from river basins and groundwater aquifers, the water supply reports describe the movement of this water through the constructed supply systems that deliver water to users.
Water supply systems typically supply within irrigation districts or towns and urban areas. Some infrastructure services both end uses. Occasionally, environmental entitlements are supplied using the water supply systems.
Providing water accounts for water supply systems enables water corporations and the community to understand where delivery efficiency improvements to reduce losses can be made.
Some information that was previously contained in the surface water accounts can now be found in the water supply system accounts. This includes recycled water accounting and a summary of urban restrictions.
Water supply local reports
The water supply system water balance is the principal water accounting tool for these local reports. It provides a statement of the water flows in a water supply system for the water year, where the sum of the outflows from the system equals the sum of the inflows, minus the water accumulated in the system.
Each of Victoria's 18 water corporations has a report that provides water supply system accounts (under water deliveries) and recycled water accounts.
The water supply reports landing page allows users to select from lists of water corporations with urban, rural and common water supply systems. These are defined as follows.
Urban water supply systems primarily supply urban customers.
- They may supply a single town or a group of towns, and may also transfer water to other water supply systems.
Rural water supply systems primarily supply irrigation water.
- Some rural supply systems also supply other commercial customers, urban systems and domestic and stock water.
Common water supply systems are bulk or feeder systems that supply 2 or more water supply systems.
- They typically have few or no retail customers.
- Examples include Melbourne Water’s system, the Goldfields Superpipe (operated jointly by Coliban Water and Central Highlands Water) and the Waranga Western Channel (which supplies several irrigation and other systems, including the Goldfields Superpipe).
Some local water supply reports also provide accounts for combined water supply systems. These are systems that supply both urban and rural customers. Wannon Water and Grampians Wimmera Mallee Water both operate combined systems.
Water supply system water balances
Start and end volume in store
This represents the volume of water held in storages thatare accounted for within the water supply system (for example, the account for Castlemaine water supply system includes water stored in McKay Reservoir) at the start and end of the water year. In systems where this volume changes during the year, these volumes are an important part of the water balance.
On-stream storages (for example, Lake Eildon) are not considered to be part of water supply systems as they are already covered in river basin accounts. The bulk water entitlements that authorise water being taken from waterways serve as a guide to whether a storage is off-stream.
As far as possible, the Accounts have been prepared on a consistent basis, while recognising the substantial differences between systems.
Inflows
The inflows section of the water balance shows all water flows into the water supply system. These inflows may be direct from surface water, from groundwater or from another water supply system. Where a system has a water storage, and rainfall can be estimated for that storage, it may also include rainfall on storages.
Outflows
Deliveries
The outflows section of the water balances shows all deliveries or transfers from the water supply system. It shows the type of use, e.g. urban residential, urban non-residential or rural, as well as any transfers to another water system or other water entity.
Losses
Losses in the water supply system water balance represent the amount of water lost after the point of extraction from a river or other water system.
Loss is generally calculated as the difference between the inflows to the system and the known deliveries and outflows.
Depending on the system, the loss may comprise up to 3 parts:
- Reticulation losses represent the loss in the actual reticulation system (the series of pipes connecting customers).
- Treatment plant losses represent the loss incurred during the water treatment process.
- Other system losses typically represent the loss of water from between the point of extraction and the actual reticulation system.
As these types of losses are not consistently recorded or provided by the water corporations, the tables in these Accounts show a single line item for system losses.
Where a system has a water storage, and evaporation can be estimated for that storage, outflows may also include evaporation from storages.
Water supply system efficiency
System efficiency is calculated using the following formula:

where total outflows includes deliveries, water passed to other systems and losses.
Efficiency is a measure of the proportion of the water flowing through each system that can be used, i.e. that which is not lost to evaporation or system losses.
The above system efficiency formula is only one of many commonly used in the water industry.
In systems where there is a large balancing item (which implies poor measurement somewhere), the efficiency calculation may be relatively meaningless. In such cases, the system efficiency is presented as n/a (not applicable).
Recycled water
Recycled water is wastewater that has been treated to an appropriate standard at a wastewater treatment plant, then subsequently reused for another purpose. In Victoria, recycled water can be used for a range of non-drinking uses including agriculture, irrigating sports fields and public open spaces, residential, commercial or industrial uses, or for environmental benefit.
Urban water corporation local reports contain a table and chart showing the volumes of wastewater that is treated and either recycled for various end uses or discharged. The statewide water supply report provides a chart that shows the volumes of treated wastewater produced and the proportion of this that has been recycled for use, over previous years.
Changes to recycled water reporting in 2021-22
The ESC introduced several new categories (marked below with an asterisk [*]) of recycled water use and discharge in 2021-22, which provide for a clearer picture of the way recycled water is managed and used. These changes mean that it is not possible to confidently compare 2021-22 or later recycled water data with that from earlier years.
There was also a change in 2021-22 to the method for calculating the total percentage recycled value.
- Previously, this was calculated as the total volume recycled for use, as a percentage of the volume of treated wastewater produced, excluding other inflows such as water from a previous year withdrawn from storage. This allowed percentages over 100%. For example, in 2020-21, the Stawell treatment plant produced 333 ML treated wastewater, and recycled significantly more than this – 536 ML – producing a figure of 161% recycled. The other inflow is not explicitly recorded in the table.
- From 2021-22, total percentage recycled is calculated as the total volume recycled for use, as a percentage of total inflow (i.e. the volume of treated wastewater produced plus any water drawn from storage or transferred from another plant.). This provides a clearer picture of the fraction of available treated wastewater that is used productively.
Data about treated wastewater availability and recycled water use is collected from water corporations each year by the Essential Services Commission (ESC). The ESC's definitions of the various categories are provided below.
Class of water
This is the class (a, b or c) of treated effluent produced at each treatment plant. Water corporations can list more than one effluent class for each treatment plant.
Volume of treated wastewater produced
This item reports the volume of treated wastewater produced by wastewater treatment plants; it is defined as the net volume (ML) of treated sewage produced as effluent from a sewage treatment plant, excluding evaporative losses from the treatment process.
Other inflow
This category has been created by DEECA for the Accounts, not by the ESC. It commonly represents water held in storage from a previous year that is used for customers or discharged.
It may also represent water transferred from another treatment plant, or be used as a balancing item where there is uncertainty in other measured volumes. A comment is generally provided under the table to explain this item.
Total inflow
This table column sums the volume of treated wastewater produced and other inflows.
Supplied to retailers
This item, which applies to Melbourne Water only, reports the volume delivered to retailers.
Recycled for domestic/residential uses*
This use category is defined as recycled water supplied for residential purposes, for example, via third pipe schemes.
Recycled for municipal uses*
Recycled water used for municipal purposes, including open space, sporting oval and nature strip irrigation; community gardens; and municipal-run golf courses; and for supplementing recreational lakes (e.g. recycled water provided to Lake Wendouree).
Recycled for commercial uses*
Recycled water used for commercial purposes including, firefighting; construction activities such as dust suppression and sand washing; for offices, shops and accommodation; and for privately owned irrigation (e.g. golf courses, school ovals, racecourses, cemeteries).
Recycled for industrial uses*
Recycled water used for industrial and manufacturing processes.
Recycled for agricultural uses
Agricultural uses, including irrigation, forestry and livestock. This excludes discharge for irrigation or release to land where there is no customer, community group or similar entity using products generated by irrigation.
Recycled for beneficial allocation
This describes treated effluent discharged to a waterway for recognised environmental purposes (as prescribed by the Environment Protection Authority [EPA]). This must involve a quality characteristic that is a net benefit to the environment.
The EPA is developing guidance for the use of recycled water for environmental purposes. Volumes reported under beneficial allocation will ultimately be expected to align with this policy following its development.
Recycled within process
This category describes recycled water used in the water treatment process; for example, for mains flushing, back-flushing filters and other consumption due to operations.
This value is included in the total volume recycled. Often, a volume of water is used within process but not consumed; and it is subsequently either used for another purpose or discharged. In these cases, this table reports that volume only once, under its final use or discharge category, to avoid double-counting.
Total volume recycled
This column totals the volume (ML) of all treated effluent that is used by either the water corporation, a business supplied by the water corporation, or supplied through a third pipe system for urban reuse. It is the sum of water recycled for domestic/residential, municipal, commercial, industrial, agricultural, beneficial allocation and within process uses.
Total percentage recycled
This is the total volume recycled for use as a percentage of the total inflow.
Released to land*
This category reports the volume used for irrigation or released to land for the purpose of disposal where there is no customer, community group or similar entity using products generated by irrigation.
Ocean outfall discharge
This reports disposal of treated effluent to ocean outfalls under an EPA waste discharge licence.
Inland water discharge
This describes disposal of treated effluent to inland water (e.g. a river or stream) under an EPA waste discharge licence.
Other outflow
This category has been created by DEECA for the Accounts, not by the ESC. It commonly represents water transferred to storage to be used or discharged in a subsequent year.
It may also represent water transferred to another treatment plant, or be used as a balancing item where there is uncertainty in other measured volumes. A comment is generally provided under the table to explain this item.