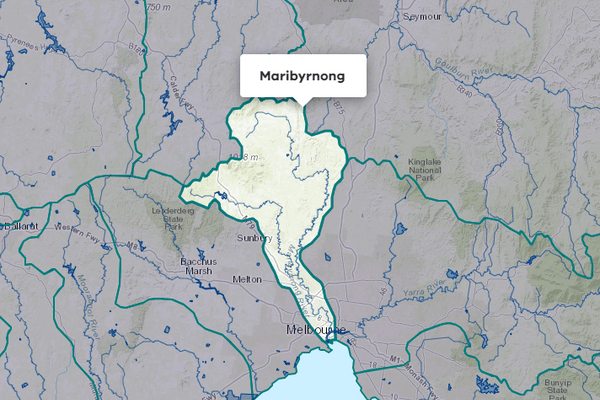
About the area
The Werribee basin is located west of Melbourne. The Werribee and Lerderderg Rivers meet upstream of Melton Reservoir and flow through Werribee before entering Port Phillip Bay.
Annual rainfall in the basin is over 900 mm in the headwaters of the Lerderderg River, but averages only 400-600 mm annually in the rest of the catchment, resulting in low flows in many of the waterways during the summer months.
The flow regimes of rivers in the basin are highly regulated and water is diverted for irrigation and urban use.
More information on water management and accounting is detailed in Water
2022-23 overview
Available water
Catchment inflow was higher than the previous year.
Licensed diversion restrictions
There were no restrictions on licensed diversions, the same as the previous year.
Seasonal determinations
Werribee system reached 100% allocation to high-reliability water shares – the same as the previous year.
Water use
A similar volume of water was diverted for consumptive purposes to the previous year.
When compared to the previous year, in 2022-23:
- more rainfall was received and storage levels peaked at higher levels
- catchment inflows were higher - the largest volume received in the last 18 years
- licensed diversion restrictions were the same, with no restrictions on licensed diversions from unregulated streams
- seasonal allocations for high and low-reliability entitlements reached 100% allocation a month earlier
- a similar volume of water was diverted from the basin for consumptive uses.
Climate
2022 flooding
In October 2022, a series of low-pressure systems or surface troughs travelled east over Australia, bringing heavy rainfall and storms. The cumulative impact of these on catchments and waterways led to widespread flooding in several basins. Major flooding of the Werribee River impacted towns including Ballan.
Rainfall
In 2022-23, rainfall across the Werribee basin was higher than the previous year. Rainfall was very much above the long-term average in the north-west around Pykes Creek Reservoir and Lerderderg State Park, and above average from Merrimu Reservoir to Port Phillip Bay.
Figure 1 displays the rainfall received in 2022-23 compared to the long-term average (1975-2023).
Figure 1: Rainfall deciles, Werribee basin
Sourced from the Australian Bureau of Meteorology
River basin water balance
This section describes the known and estimated inflows, outflows and change of storage volumes in the basin.
Of the total inflows, 84% flowed out into Port Phillip Bay in 2022-23.
Water balance table
The table below shows the total volumes of water available and supplied from water resources in the Werribee basin in 2022-23.
Table 1: Water balance, Werribee basin
Major on-stream storages
Major - greater than 1,000 ML - on-stream storages in the Werribee basin are included in the water balance.
Storage levels
Major on-stream storage levels in the Werribee basin were 90% on 30 June 2023.
Higher than the previous year
Storage levels in the Werribee basin were 79% on 30 June 2022.
Table 2: Storage levels, Werribee basin
Inflows
Catchment inflow
Catchment inflow represents the volume of water flowing into the waterways of a basin. It is calculated to be the difference between the total outflows, the known inflows and the net change in storage volume.
The 2021-22 catchment inflow volume has been updated from the published 2021-22 VWA.
Above average inflows of 283,382 ML were received (320% of the long-term average of 88,600 ML), more than the previous year (150% of the long-term average). This was reflective of the very much above average rainfall received across the basin in 2022-23.
Above average inflow received
Catchment inflow was 320% of the long-term average of 88,600 ML.
More water received than the previous year
Catchment inflow was higher than the previous year (150% of the long-term average).
Wastewater treatment plants
Water treated at wastewater treatment plants can be used to supplement water available in the basin. Water discharged to waterways from treatment plants is included as an inflow to the water balance.
Information on treatment plants is reported in the water supply local reports for the water corporation responsible for managing the plant.
In this basin, wastewater treatment plants are managed by Greater Western Water and Melbourne Water.
Outflows
Diversions
In 2022-23, 16,241 ML of water was diverted for consumptive uses: town, domestic and stock, irrigation and commercial supply. This was similar to the 17,174 ML diverted in the previous year.
Small catchment dams
Water harvested, used, and lost by small catchment dams (farm dams) is included in the water balance.
Table 3: Small catchment dams, Werribee basin
Entitlements and compliance
Entitlements provide the basis for how water is shared in the basin.
In the Werribee basin, most entitlements to water allow unused water to be carried over to the next season (except for 15% of the unused volume which is deducted for evaporation); and entitlement holders can hold up to 100% of their entitlement volume. The VEWH holds an environmental entitlement in the Werribee basin, which also enables it to carry over unused water at the end of each year, subject to storage capacity and losses. The water available under the entitlement is used to provide environmental flows in the Werribee River and is not diverted out of the waterway.
Entitlement volumes
Rights to water in the Werribee basin are shown in Table 4.
Entitlement volumes represent a maximum volume of water that can be taken in a one-year period. The volume available in a particular year is dependent on the rules for allocating water set out in the entitlement and the seasonal conditions in that year, which can vary. The rules for allocating water under an entitlement differ between entitlements and systems. This affects the ability and likelihood of water being taken in a particular year.
Table 4: Annual entitlement volumes at 30 June, Werribee basin
Available water and take under entitlements
Total water available under entitlements represents the volume of water that was available to be taken by entitlement holders in 2022-23. The volume includes carryover from the previous year, seasonal allocations and net trade into the basin.
Water taken
There was 15,447 ML taken under entitlements in 2022-23, less than the previous year (17,266 ML).
Seasonal allocations and restrictions on licensed diversions from unregulated rivers
- High-reliability entitlement allocations reached 100% in August 2022 (1 month earlier than the previous year). Low-reliability entitlements reached 100% in December 2022 (1 month earlier than the previous year).
- There were no restrictions on licensed diversions from unregulated streams in 2022-23, the same as during the previous year.
Available water and take table
This table shows the volume of available water and the volume taken under entitlements in 2022-23.
More information on available water and take has been detailed in How do we account for surface
In 2022-23, less water was taken under entitlements than the previous year.
Table 5: Available water and take under entitlements, Werribee basin
Compliance
Compliance against water entitlements is reported for this basin in 3 areas:
- entitlement issued: that the volume of entitlements issued in a basin does not exceed formal caps, and has not increased without appropriate approvals
- water taken: that the volume of water taken during the year does not exceed the volume considered to be available for consumptive and/or in-stream use during that year
- bulk entitlement provisions: that holders of entitlements do not breach any provisions that are documented in their bulk entitlement orders.
Total entitlement volume
There was no net increase in the total entitlement volume from the previous year
Total volume diverted
The total volume diverted under entitlements (15,487 ML) was within the volume available for the year (42,872 ML).
Individual bulk entitlements
No individual bulk entitlement holder took more than the annual volume made available to them.
Exceptions to compliance
Individual bulk entitlement holders complied with all provisions in their entitlements except one. See note below.
Notes on exceptions to compliance:
- On the Werribee River downstream of Melton Reservoir, SRW failed to meet the passing flow requirement for 15 ML/d for a period of 12 days in July 2022. The flow recommenced as soon as the error was identified and wet conditions at the time minimised any environmental impact. The loss of flow was made up at a later date as determined by the VEWH, SRW and Melbourne Water. A review of SRW’s processes have been undertaken to prevent a reoccurrence of the breach.
Water for the environment
Environmental watering sites
Environmental watering sites and environmental values in the Werribee basin that depend on water for the environment include:
- platypus that inhabit the lower reaches of the Werribee River
- the freshwater-saltwater interface of the Werribee River estuary: it is a regionally significant ecosystem, due to the many aquatic plants and animals it supports and its provision of nursery habitat for juvenile freshwater fish species and estuarine species (such as black bream)
- Australian grayling, tupong and red gums.
Environmental water reserve
In 2022-23, water for the environment in the Werribee basin comprised:
- the Werribee River Environmental Entitlement 2011, which includes 10% share of inflows (on average 1,500 ML per year) held by the VEWH in Lake Merrimu
- 734 ML of high-reliability water shares and 361 ML of low-reliability water shares held by the VEWH for the environment in Melton Reservoir
- water set aside for the environment through the operation of passing flow conditions:
- on consumptive bulk entitlements held by Central Highlands Water, Greater Western Water and Southern Rural Water
- on licensed diversions (regulated and unregulated waterways)
- all other water in the basin not allocated for consumptive uses: this water also provides social, recreational and cultural benefits.
Environmental water use
In 2022-23, a total of 1,964 ML of environmental water was delivered in-stream in the Werribee basin.
Management responsibilities
Management of water in the Werribee basin is undertaken by various parties.
| Authority | Management responsibilities |
|---|---|
| Southern Rural Water |
|
| Greater Western Water |
|
| Melbourne Water |
|
| Central Highlands Water |
|
| Water supply system | 2021-22 (ML) | 2022-23 (ML) |
|---|---|---|
| Blackwood & Barrys Reef System | 54 | 70 |
| Main integrated system | 1,902 | 1,773 |
| Myrniong | 35 | 45 |
| Water supply system | 2021-22 (ML) | 2022-23 (ML) |
|---|---|---|
| Bacchus Marsh Irrigation District | 2,253 | 2,210 |
| Werribee Irrigation District | 10,322 | 8,966 |