On this page:
Message from the Minister

I am pleased to share with you the latest initiative from our drive to make water information more easily accessible, interactive and engaging.
This new Victorian Water Accounts (VWA) website allows users to explore information about water availability and use more readily than before.
On the new website you will see the 2021-22 Victorian Water Accounts – the 19th in its series and the first to be a completely digital offering.
I invite you to explore the site, including the interactive graphs, maps, tables and data downloads, to understand the story of water availability and use in the 2021-22 year. For example, in 2021-22:
- the total volume of water available – including surface water, groundwater, recycled water and desalinated water – was about 34,670 GL, the highest volume since the breaking of the Millennium Drought in 2010-11.
- the greater availability led to fewer restrictions on water use and higher allocations to regulated system entitlements than in recent years. For example, the Victorian Murray basin received a 100% allocation to low-reliability entitlements for the first time since the introduction of the current entitlement products in 2007.
- major water storages ended the year at 83% full (up from 61% at the start of the year), which, importantly, puts us in a very strong position to be prepared for the next dry year when it comes.
For the first time this year, the VWA reports on the volume of water entitlements held by Traditional Owner organisations. This will help us monitor our progress against Targeted Outcome 7 in Water is Life Traditional Owner Access to Water Roadmap: Water is returned to Traditional Owner groups across Victoria through the issue of water entitlements for their self-determined use. Future accounts will build on this reporting in partnership with Traditional Owners.
Previous VWA reports from 2003-04 onwards are still available on , as part of the Government’s ongoing commitment to transparency and accountability in the sustainable management of Victoria’s water resources.
If you have any feedback or suggestions for the new site, the team is very happy to hear them! Please get in touch at water.reporting@delwp.vic.gov.au.
THE HON HARRIET SHING
Minister for Water
Overview
Wetter conditions
More rainfall was received across the state, with more water flowing down rivers and into storages than the previous year.
More water was available
The total available volume of surface water, groundwater and recycled water was higher than the previous year. The volume of desalinated water produced was the same as the previous year.
Fewer stream restrictions
There were fewer restrictions on licensed diversions from unregulated streams and groundwater than the previous year.
Urban restrictions were the same
All towns remained on permanent water saving rules for the whole of 2021-22, the same as the previous year.
Table 1: Available water, entitlements and use (ML)
Water availability
- Most of the state received more rainfall than in the previous year. Rainfall was above average in the north-west, and very much above average in the north-east and eastern Gippsland.
- There was a negative Indian Ocean Dipole from June to November 2021 and a La Niña event from November 2021 to June 2022. Both of these contributed to increased rainfall across the state.
- More water was available than the previous year (34,669,411 ML in 2021-22 compared to 23,942,065 ML the previous year).
Rainfall
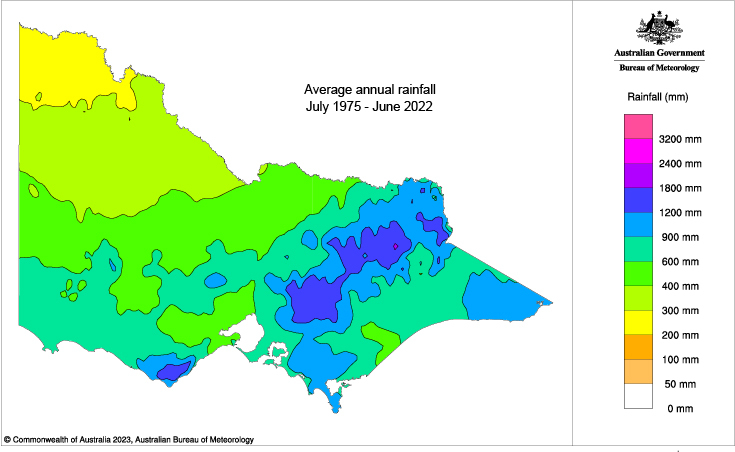
Long-term average annual rainfall in Victoria (July 1975 to June 2022 – Figure 2a) varies from less than 300 mm in the north-west of the state to up to 1,800 mm in the Alpine area of the north-east.
Total rainfall received in 2021-22 varied across the state from below 300 mm to over 1,800 mm (Figure 2b).
- The driest parts of the state — receiving below 400 mm rainfall — were found in the north-west.
- The wetter regions — receiving over 1,200 mm — were found in the Yarra Ranges, the Alpine Region, the Otways, East Gippsland and in parts of south Gippsland.

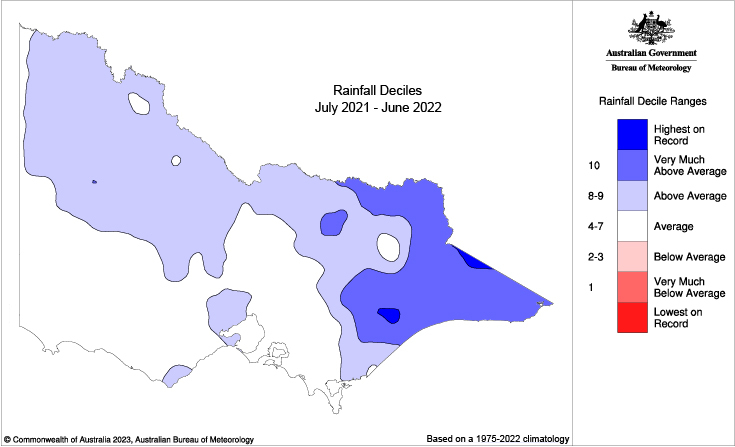
Most of the state received more rainfall than in the previous year. When compared to the average annual rainfall (Figure 2a), rainfall was close to average in the south-west and south-central regions of the state and above average in most of the rest of the state (Figure 3).
- Average rainfall was received along the South Australian border, in the south-west, the central southern areas and South Gippsland.
- Rainfall was above average in most of the north, east and in the south-west over Werribee and Cape Otway.
- Rainfall was very much above average in the north-east and eastern Gippsland.
- The highest rainfall on record was received near Maffra and north-east of Omeo.
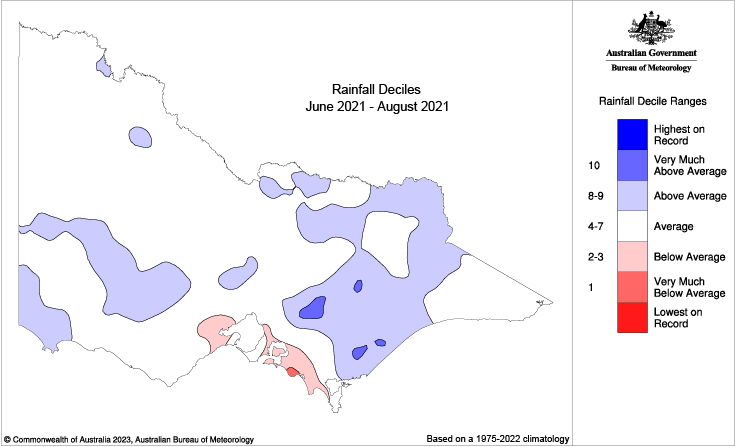
Winter 2021 (Figure 4a)
- Winter rainfall was close to average across most of Victoria.
- It was wetter than average in central Gippsland, the alpine regions, and parts of the south-west.
- It was drier than average only in Greater Geelong and the Bass Coast.
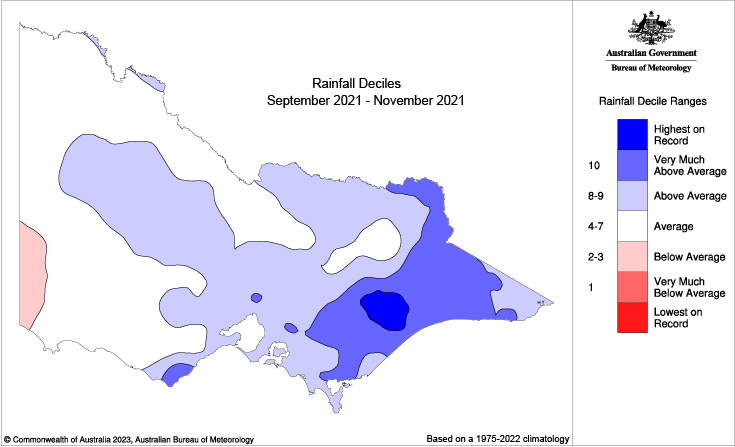
Spring 2021 (Figure 4b)
- Spring rainfall was above average in most of central and eastern Victoria.
- It was much wetter than average in most of Gippsland.
- It was only drier than average in Victoria's south-west along the South Australian border.
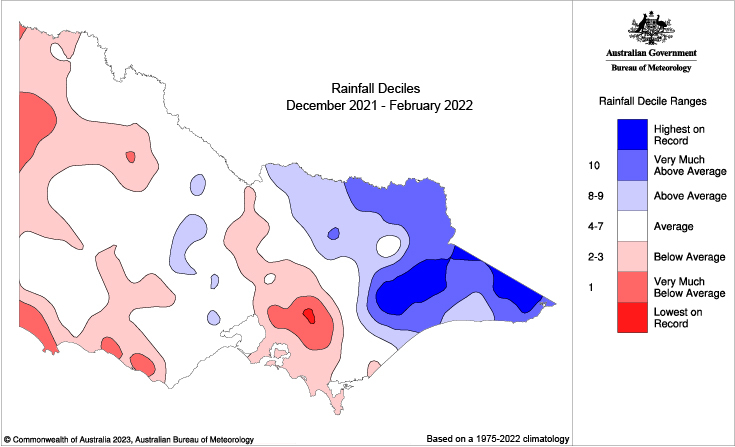
Summer 2021-22 (Figure 4c)
- Summer rainfall was above average in the north-east and below average in the south and west of the state.
- It was much wetter than average in east Gippsland, north-eastern regions, and the alpine regions.
- It was much drier than average around the Yarra Ranges, as well as in the west interior and western coastline of the state.
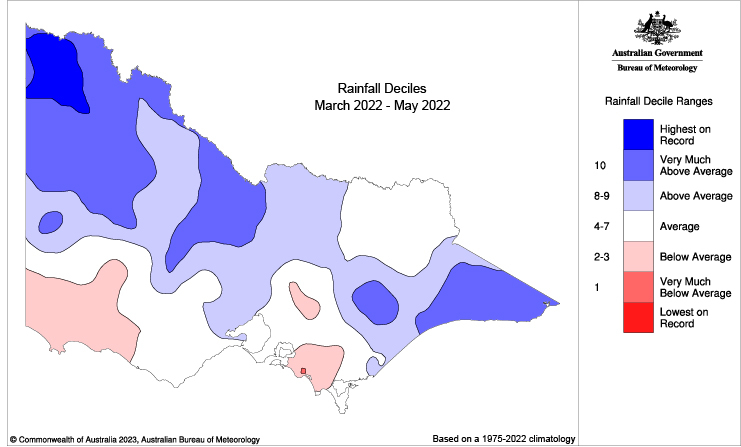
Autumn 2022 (Figure 4d)
- Autumn rainfall was wetter than average for large parts of the state’s north and east.
- It was very much wetter than average in the north-west.
- It was drier than average in the south-west corner, South Gippsland and the Yarra Ranges.
La Niña and a negative Indian Ocean Dipole
On 20 July 2021, the Bureau’s Climate Driver declared that a negative Indian Ocean Dipole (IOD) had been established, bringing with it above-average winter-spring rainfall. The IOD began to weaken in November 2021 just as La Niña established itself in the tropical Pacific, further increasing the chances of above-average rainfall in Victoria.
La Niña continued until 21 June 2022 when most of the El Niño–Southern Oscillation indicators began to ease.
This is likely to have contributed to higher than average rainfall, as well as flooding and high storage levels across the state.
Total water available
Overall, the total available volume of Victoria’s surface water, groundwater, desalinated water and recycled water in 2021-22 was 34,670,303 ML (Table 2 and Figure 5), more than the amount available in the previous year (23,942,065 ML).
- More surface water, groundwater and recycled water was available.
- The same volume of desalinated water was produced.
Table 2: Total available water
Response to water availability
The amount of water available for consumptive and environmental uses will vary from year to year. The entitlement and planning frameworks include mechanisms to conserve and share water between users in response to seasonal variability and water shortages. We have provided more information on these mechanisms in the How is water managed? page.
In 2021-22:
- there were higher seasonal allocations (statewide surface page)
- there were fewer restrictions on licensed diversions from unregulated streams (statewide surface page) and groundwater (statewide page)
- all towns remained on permanent water saving rules, with no additional restrictions on use (statewide water page)
- no water carting was required to supplement supplies
- there were no temporary qualifications of rights to water.
Water use
Water for all types of uses in Victoria is taken from reservoirs, streams and aquifers under entitlements issued and authorised under the Water Act 1989.
Read more about different uses under the entitlement framework in How is water managed?.
In 2021-22, 4,429,115 ML was used (for consumptive and environmental purposes), similar to the previous year (4,052,079 ML) (Table 3, Figure 6 and 7). This includes surface water, groundwater, recycled water and desalinated water.
- 3,413,438 ML was used for consumptive purposes (similar to the 3,395,360 ML used in 2020-21).
- 1,015,677 ML was delivered to the environment (higher than the 656,719 ML delivered in 2020-21).
Table 3: Water use by type
Water entitlements
The total volume of entitlements changes each year as new entitlements are issued or existing entitlements are modified. All river basins in the state have a cap on entitlements, and groundwater management units have a Permissible Consumptive Volume (PCV), which limit the volume of water that can be allocated. In areas that have reached the cap/PCV and allocated all available water within the limit, no new entitlements are created unless water savings are made, and so there is no net increase in entitlement volume.
Read more about entitlements in How is water .
Traditional Owner organisations hold surface water and groundwater entitlements. The entitlement volume held by these organisations is included in Table 4 in the consumptive entitlement volume totals. At 30 June 2022, this volume was around 6.8 GL. The organisations used for this estimation include Registered Aboriginal Parties as well as other known Aboriginal organisations and cooperatives.
In 2021-22, entitlement volumes were slightly higher than the previous year due to some changes to surface water entitlement volumes (Table 4 and Figure 8). Visit the "Entitlements and compliance" section in the statewide surface page for more information.
Table 4: Water entitlements by type
Evapotranspiration
Evapotranspiration is the sum of all processes by which water moves from the land surface to the atmosphere via evaporation and transpiration. Evapotranspiration amounts vary considerably across Victoria depending on a range of factors including climatic conditions and land cover.
- Averaged across Victoria as a whole, evapotranspiration in 2021-22 was estimated to be 620 mm.
- This is about 11% above the long-term average (post 1975 historic climate reference period) evapotranspiration.
- When estimated at a basin scale, evapotranspiration was generally high, with most Victorian basins experiencing evapotranspiration at or above the long-term average conditions.
- In general, 2021-22 was a wet year with rainfall exceeding the long-term average conditions in most river basins.
- Read the for more detail on evapotranspiration in 2021-22.
Looking for more information?
The VWA reports on availability and use across surface water, groundwater, water supply and water for the environment. The structure has changed a bit from the PDF report - go to our mapping to locate the section you are looking for.
Statewide summaries
Learn about different aspects of water availability and use across Victoria in 2021-22.
Local reports
Explore the local water reports by surface water, groundwater or water supply.