On this page:
About groundwater
- Groundwater is found in the spaces and fractures in rock and sediment beneath the ground’s surface.
- Where groundwater is held within an aquifer it can be pumped to the surface for use.
- This page reports on statewide groundwater use, entitlements and compliance and trade for 2021-22.
- Groundwater information is reported in these accounts by groundwater catchments or groundwater management units (GMUs).
- Local reports can be selected and viewed by either GMU or groundwater catchment via the groundwater local page.
- There are 20 groundwater catchments, 8 in the north and 12 in the south.
- Within groundwater catchments, there are smaller management units — groundwater management units (GMUs) — which are either water supply protection areas (WSPAs) or groundwater management areas (GMAs). Groundwater resources that are licensed and used outside a WSPA or GMA are reported as ‘outside management units’.
- There are 55 GMUs, and of these there are 44 GMAs and 11 WSPAs.
More information:
- Groundwater resources are explained in Water .
- Water management is detailed in How is water
- Groundwater accounting is detailed in How do we account for
2021-22 overview
Restrictions on use
There were fewer restrictions on licensed groundwater use than the previous year.
GMU changes
No gazetted changes to GMUs.
Water use
Less groundwater was taken for consumptive purposes than the previous year.
In 2021-22:
- groundwater level trends were largely consistent with the previous year
- 4 GMUs were subject to restrictions on licensed groundwater use: one fewer than in the previous year
- there were no gazetted changes made to GMUs
- about the same volume of groundwater was available to take under entitlements
- less groundwater was taken for consumptive purposes
- there were fewer temporary trades and more permanent trades of groundwater take and use licences.
Groundwater level trends
Groundwater systems are dynamic and adjust continually to short-term and long-term changes in climate, groundwater withdrawal, and land use. Groundwater trends are one type of measure that can give an indication of the condition of the groundwater resource, somewhat analogous to storage levels for surface water. Trends in groundwater levels reflect differences between the amount of water flowing into (recharge) and out of (discharge or extraction) an aquifer.
For more information on why we report groundwater levels, see the Keeping track of Victoria’s water section of the How is water page.
In the accounts, groundwater level trends for groundwater management units (GMUs) have been determined based on monitoring data from key bores in the State Observation Bore Network. Trend determinations are made quarterly by comparing each reading to a previous reading in the same season 5 years prior. That is, a summer record is compared to the summer record from 5 years before to account for seasonality.
Groundwater resources are being actively managed. For more detail on the management responses go to the groundwater sections on the Goulburn-Murray , Grampians Wimmera Mallee and Southern Rural websites.
2021-22 groundwater level trends
In the June quarter of 2021-22, 5-year groundwater level trends were similar to the previous year.
Of 11 water supply protection areas (WSPAs), 6 were categorised as stable, 3 as rising and 2 as declining, compared to 4 stable, 3 rising and 4 declining in the previous year.
Of 41 groundwater management areas (GMAs), 20 were categorised as stable, 10 as rising and 11 as declining, compared to 18 stable, 12 rising and 11 declining in the previous year.
Table 1: Groundwater level trends
Response to water availability
The amount of water available for consumptive and environmental uses will vary from year to year. The water entitlement and planning include mechanisms to conserve and share water between users in response to seasonal variability and water shortages which come into play when water is scarce. These mechanisms include restrictions to licence volumes in groundwater systems.
Groundwater licences are all-year licences. Management plans for some GMUs may include levels that will trigger the introduction of a restriction that will reduce the volume that groundwater users can take under their licence.
Groundwater restrictions
In 2021-22, entitlement holders in four groundwater management units (GMUs) were subject to restrictions on groundwater use, one fewer GMU than in the previous year. Licence holders were restricted to a percentage of their total licence volume as follows:
- Campaspe groundwater catchment - Lower Campaspe Valley WSPA, 75%.
- Goulburn Broken groundwater catchment - Katunga WSPA, 70%.
- West Port Phillip Bay groundwater catchment - Deutgam WSPA, 50%.
- West Wimmera groundwater catchment – Neuarpur Sub-Zone 1 in the West Wimmera GMA, 80%.
Water use
In Victoria groundwater can be taken from aquifers under entitlements issued and authorised under the Water Act 1989. Generally, groundwater is allocated to either water corporations or to individuals, who are issued take and use licences. In addition to this, there is one groundwater bulk entitlement issued to Barwon Water for urban supply to the Greater Geelong area.
The Act also enables individuals to take groundwater for domestic and stock use without a take and use licence.
The summary below describes the amount of groundwater extracted for various uses. For the most part, groundwater use – irrigation/commercial, urban and power generation – is metered. Domestic and stock use is estimated based on the number of domestic and stock bores in each GMU and outside management units.
More information on groundwater accounting and use is detailed in How do we account for
2021-22 summary
In 2021-22, total groundwater licensed entitlement was 953,312 ML across the state (948,278 ML in 2020-21). The total groundwater use across the state including domestic and stock use was 289,741 ML, which was less than the volume used in 2020-21 (377,047 ML) (Table 2 and Figure 2).
Use in groundwater management units (GMAs and WSPAs):
- 852,788 ML licensed entitlement, 245,157 ML metered use (compared to 852,629 ML entitlement and 330,047 ML metered use in 2020-21).
- 22,825 ML estimated domestic and stock use (compared to 23,450 ML in 2020-21).
Use outside of management units:
- 100,524 ML licensed entitlement, 14,164 ML metered use (compared to 95,653 ML entitlement and 15,838 ML metered use in 2020-21).
- 7,595 ML estimated domestic and stock use (compared to 7,710 ML in 2020-21).
Use by type
-
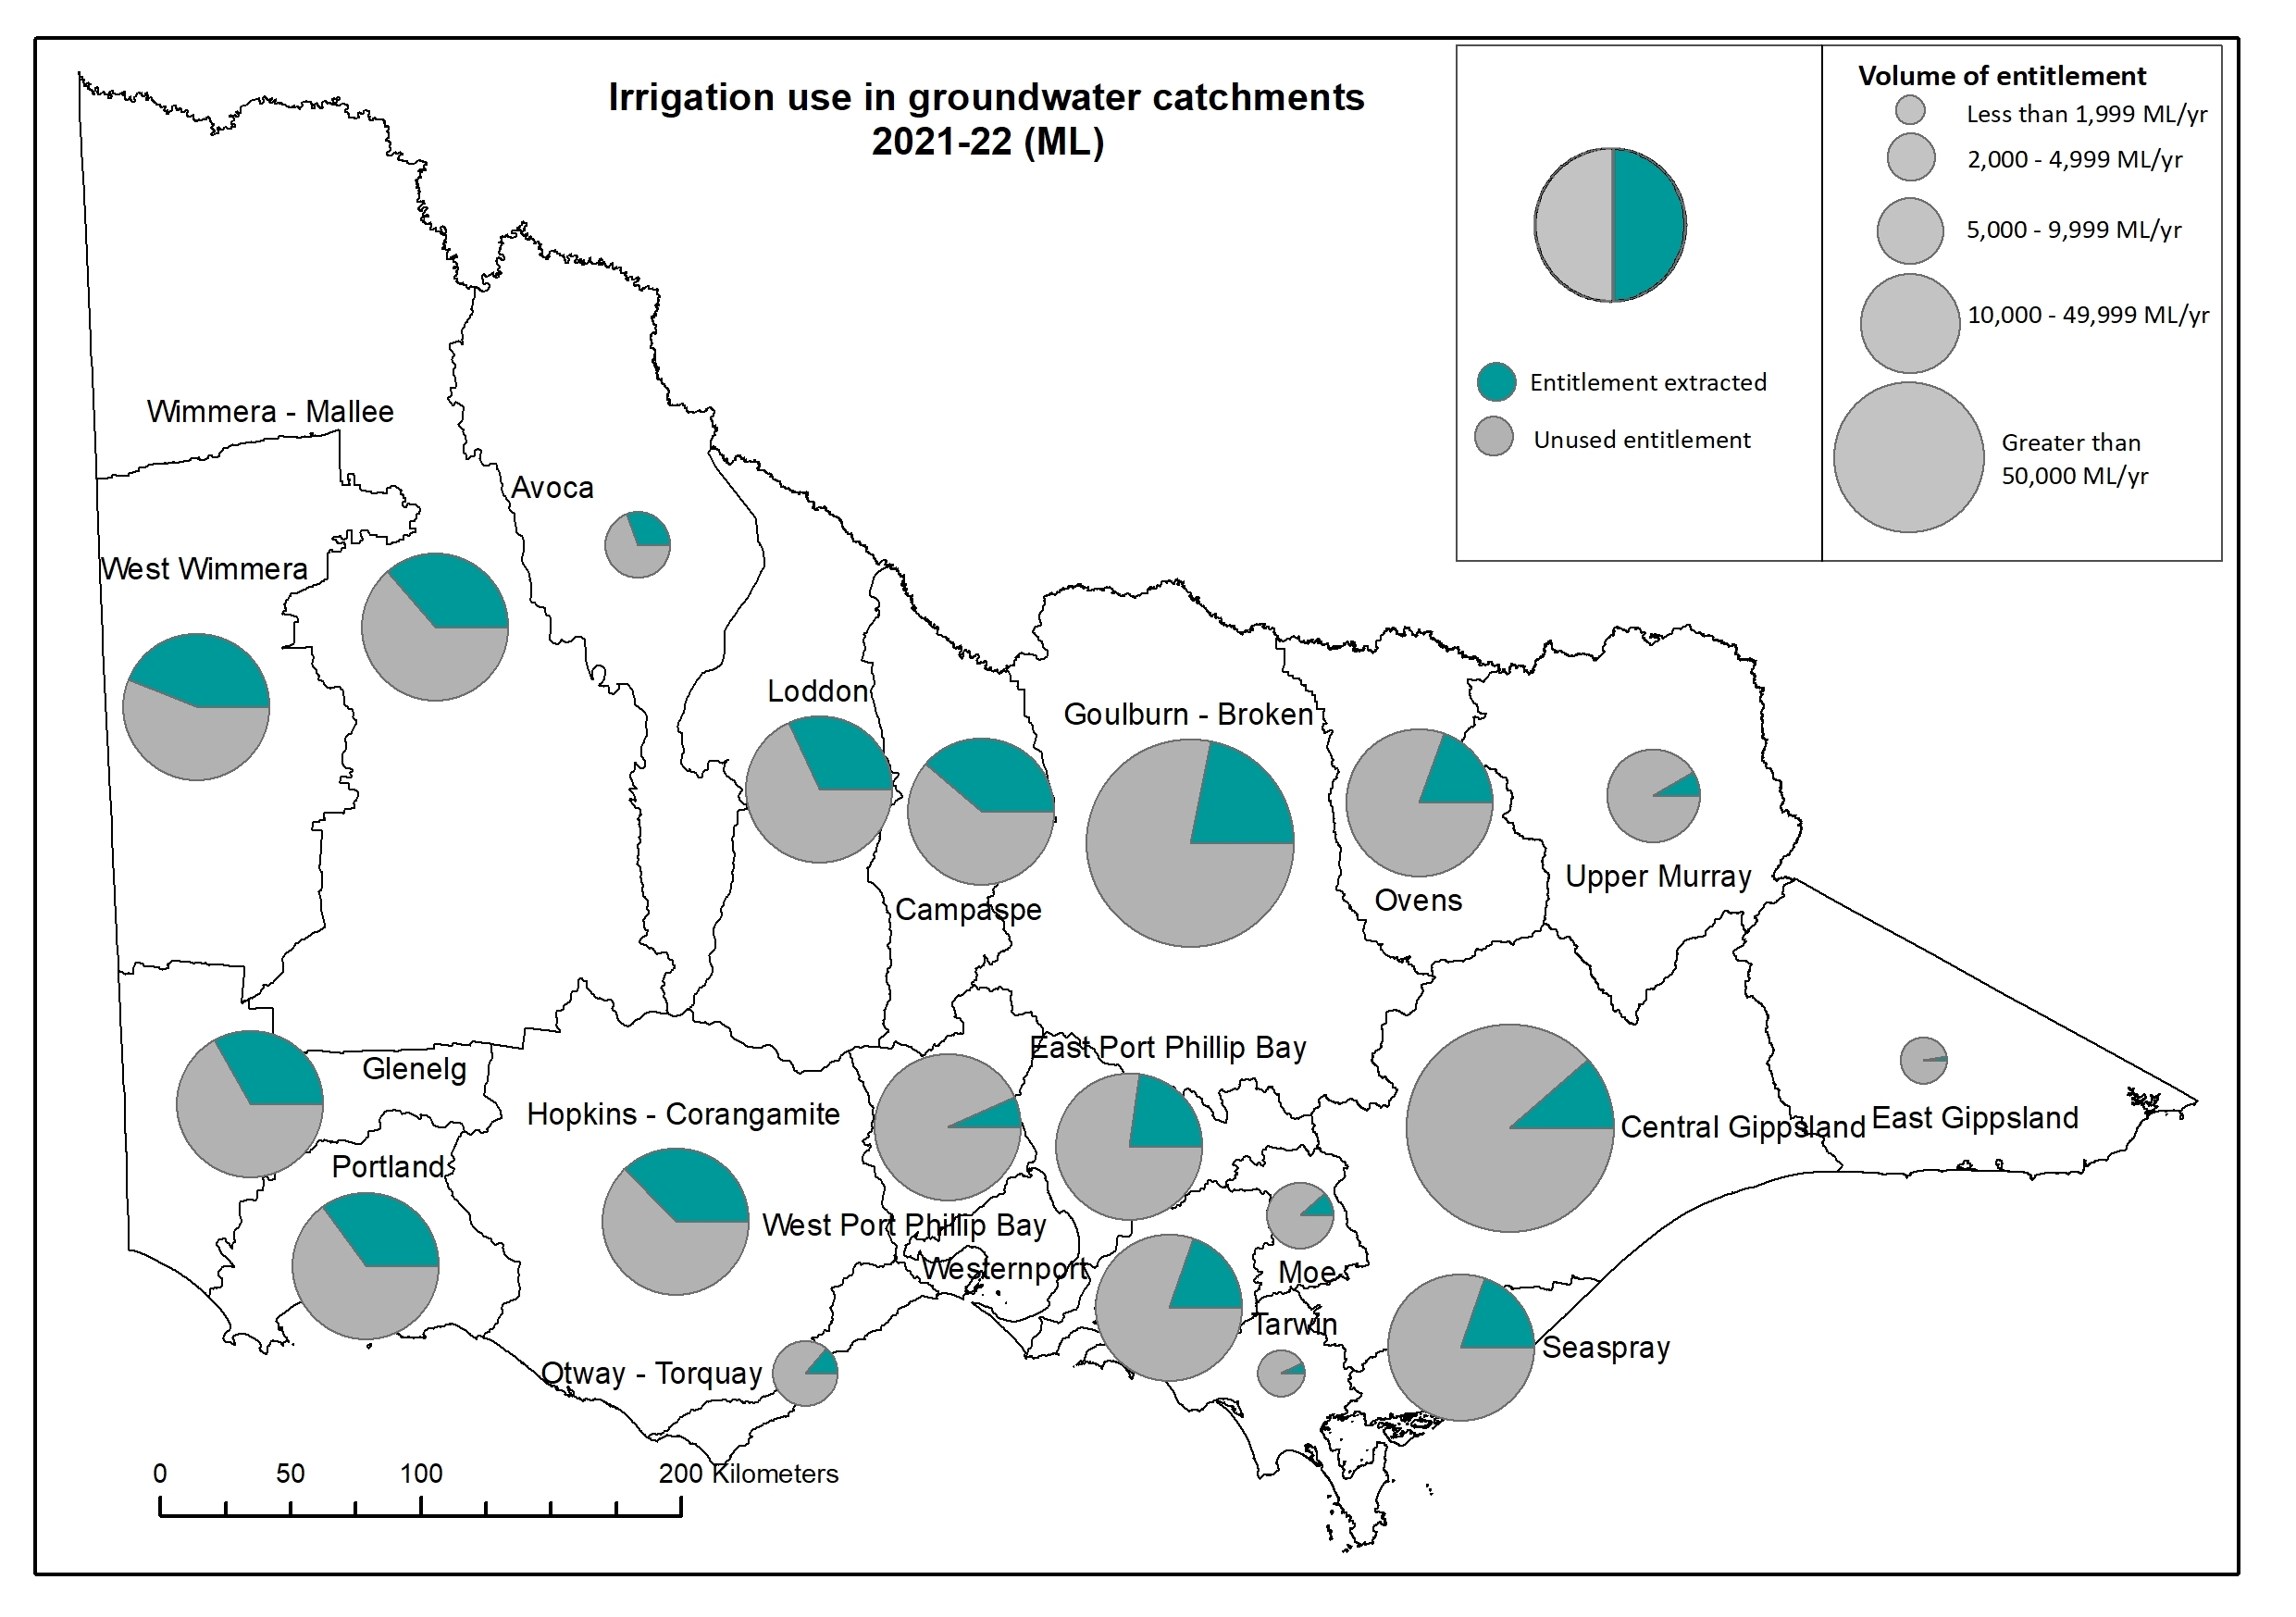
- Less groundwater used for irrigation/commercial purposes (225,155 ML compared to 312,436 ML in 2020-21). This represents about 78% of total groundwater use.
Note: Data about irrigation and commercial categories are reported together as they cannot be separated for groundwater use.
-
- More groundwater was diverted for urban purposes (9,468 ML compared to 8,226 ML in 2020-21). This represents about 3% of total groundwater use.
-
- A similar volume of groundwater was diverted for power generation (24,698 ML compared to 25,229 ML in 2020-21). This represents about 9% of total groundwater use.
-
- A similar volume of groundwater was used for domestic and stock purposes (30,420 ML compared to 31,152 ML in 2020-21). This represents about 10% of total groundwater use.
- There are 18,205 domestic and stock bores in Victoria that were less than 30 years old (considered to be currently active) in 2020-21 (compared to 18,637 the previous year).
Table 2: Groundwater diverted for different consumptive uses (ML)
Entitlements and compliance
Entitlements
Entitlements provide the basis for how water is shared. The total volume of entitlements changes each year as new entitlements are issued or existing entitlements are modified. All groundwater management units have a permissible consumptive volume (PCV), which limits the volume of groundwater that can be allocated. In areas that have reached the PCV and allocated all available groundwater within the limit, no new entitlements are created unless water savings are made, and so there is no net increase in entitlement volume.
See the Groundwater section in the How do we account for page for more information.
There were no gazetted changes of PCV or boundaries made to GMUs in 2021-22. Full details of groundwater entitlements and use from each GMA and WSPA are below in table 3.
In 2021-22, the total licensed entitlement volume for Victoria was 953,312 ML. This is slightly higher than the amount available in 2020-21 (948,282 ML) (Table 3 and Figure 3).
Available water and take
Total groundwater available under entitlements represents the volume of groundwater that was available to be taken. This item is the sum of: opening carryover, allocation issued and the net trade in or out of water. The level of allocation issued is reduced if there are any restrictions in place.
In 2021-22 (Table 3 and Figure 4):
- 962,456 ML was available to take under entitlements (958,618 ML in 2020-21)
- 259,321 ML was taken under entitlements (345,877 ML in 2020-21).
Groundwater entitlement and groundwater taken for consumptive use
In Table 3 below:
- permissible consumptive volume (PCV) sets the total volume of groundwater that may be licensed and taken in a GMU. PCVs are declared by the Minister for Water through an order published in the Victoria Government Gazette
- licensed entitlement volume shows the volume of entitlements for each GMU as at the end of the water year
- water available and taken under licenses columns show the total volume of groundwater available for extraction during the water year and licensed use in GMUs and outside management units. Total water available under entitlements is the sum of: opening carryover, allocation issued and the net trade in or out of water
- compliance section shows how much groundwater was taken as a percentage of the PCV and if there was any licensed entitlement available
- estimated domestic and stock use is based on the number of domestic and stock bores in each GMU and outside GMUs in each water corporation area.
The accounting method is explained further in How do we account for water?
Figure 5 below shows the licensed entitlement, licensed use and domestic and stock use for the last 5 years.
Table 3: Groundwater entitlement and groundwater taken for consumptive use

Compliance
Compliance against groundwater entitlements is reported in these accounts in three areas:
- entitlement issued: the volume of entitlements (not applicable for domestic and stock groundwater use) issued in a GMU (either a WSPA or a GMA) does not exceed the PCV
- water taken: the volume of groundwater taken under entitlements during the year does not exceed the total groundwater available to licence holders in that year
- bulk entitlement provisions: holders of entitlements do not breach any provisions that are documented in their bulk entitlement orders.
PCV compliance is not assessed in the following five GMUs:
- Upper Ovens WSPA: a PCV is not required because the management plan prevents additional entitlements or an increase in entitlement volume from being issued, except by trade.
- Shepparton Irrigation Region GMA: there is no PCV as there is no limit on the total volume of shallow groundwater entitlement available.
- West Goulburn GMA: there is no PCV, but there are individual zone caps set; the total recorded use in the West Goulburn GMA in 2021-22 was 991 ML, 33% of the total licensed volume.
- South West Limestone GMA: the PCV has not been gazetted. The South West Limestone GMA includes the area of the former Nullawarre WSPA, Yangery WSPA, Hawkesdale GMA and Heywood GMA and the areas outside the former GMUs but included within the South West Limestone GMA area. The PCVs for the four GMUs have not been revoked and still apply. PCV volumes are Nullawarre 22,741 ML, Yangery 14,352 ML, Hawkesdale 16,161 ML and Heywood 8,500 ML.
- Stratford GMA: current compliance assessment criteria are not applicable. Coal mine licences physically in the area are not assigned to the Stratford GMA.
For West Wimmera GMA, Wy Yung GMA, Nepean GMA, Rosedale GMA, Stratford GMA and Wa De Lock GMA, the PCV that applies is the sum of the PCVs for all zones within each GMA.
Key points on compliance against entitlements
Licensed entitlement volume
The licensed entitlement volume did not exceed the relevant gazetted PCV for each GMU, where compliance can be assessed (explanations above).
Total volume of licensed groundwater
The total volume of licensed groundwater used in each GMU was within the volume available for the year.
Individual bulk entitlements
Individual bulk entitlement holders complied with all provisions in their entitlements.
Trade
Groundwater can be traded via the trade of take and use licences. Outside of declared water , take and use licences allow water to be taken from unregulated surface water systems or groundwater to be used on the land defined in the licence.
Note: Surface water trade is covered on the state-wide surface page.
For further information:
- An introduction to the water trading framework in Victoria can be found in How is water .
- A more detailed breakdown of water trade for 2021-22 can be found in the Victorian Water Trading 2021–22 Annual .
Groundwater trade
Trades as part of land transfers were the most common type of groundwater take and use licence trade.
In 2021-22 (Table 4, Figure 8):
- the volume of temporary groundwater trade was 15,399 ML, lower than in the previous year
- the volume of permanent groundwater trade (not as part of a land transfer) was 4,121 ML, higher than in the previous year
- most trades of groundwater take and use licences were as part of land transfers, with 365 trades amounting to 49,193 ML. This is a lower volume of entitlement across a slightly larger number of trades than in the previous year.
Table 4: Trade of groundwater take and use licences in groundwater management units
There was more temporary trade of groundwater take and use licences than permanent trade of groundwater take and use licences. In all trade types, most trade of groundwater occurred in Northern Victoria, with a sizeable proportion of trade occurring in Southern Victoria and a smaller number of trades in Western Victoria.
There was more trade in groundwater take and use licences than trade in surface take and use licences. For information on surface water trade see the state-wide surface page.