About the area
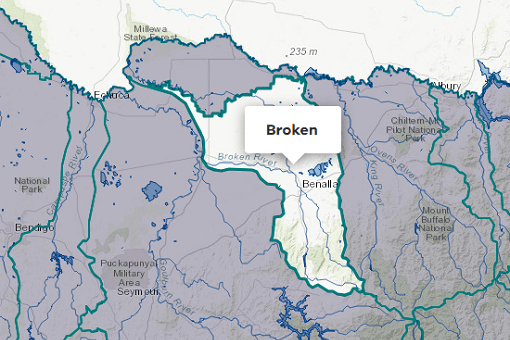
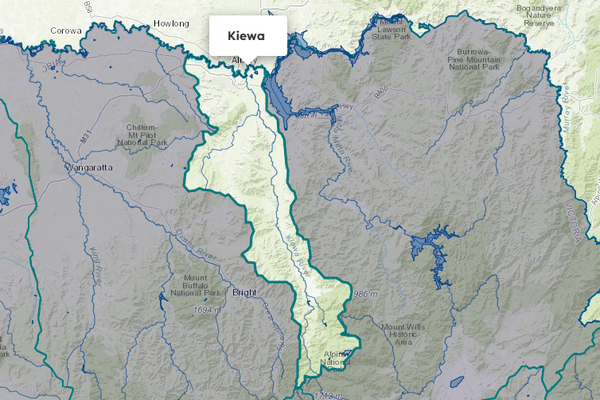
The Ovens basin is situated in north-east Victoria, covering an area that extends from the Great Dividing Range in the south to the Murray River in the north. It is bordered by the Broken basin in the west and the Kiewa basin in the east.
Generally, the high country in the south of the basin has higher rainfall than the northern regions along the Murray. At an elevation of 1,400 m, a large proportion of the winter precipitation falls as snow, with much of the high ground remaining snow-covered from June to October.
Most of the basin’s average annual precipitation occurs during winter, with the climate being warm and dry during the summer months.
Agriculture in the basin is mainly concentrated in the central region and in the north-east between Beechworth and Chiltern, where forest grazing, beef, wool, and lamb production are important.
More information on water management and accounting is detailed in Water explained.
2024-25 overview
Available water
Catchment inflow was lower than the previous year.
Licensed diversion restrictions
There were more restrictions on licensed diversions than the previous year.
Seasonal determinations
Ovens system high-reliability allocations opened at 100% (the same as the previous year).
Water use
A similar amount of water was diverted for consumptive purposes as the previous year.
When compared to the previous year, in 2024-25:
- less rainfall was received, and catchment inflow was lower
- there were more restrictions on licensed diversions from streams
- storages ended the year at higher levels
- seasonal allocations were the same, with high-reliability entitlements reaching 100% allocation; spill entitlement was also available during the year
- a similar amount of water was diverted from the basin for consumptive uses.
Climate
Rainfall
In 2024-25, rainfall received in the Ovens basin was lower than the previous year. Rainfall was below average across most of the basin.
Figure 1 displays the rainfall received in 2024-25 compared to the long-term average (1975-2025).
Figure 1: Rainfall deciles, Ovens basin
Sourced from the Australian Bureau of Meteorology
River basin water balance
This section describes the known and estimated inflows, outflows and change of storage volumes in the basin.
More detail on major on-stream storages, catchment inflows, diversions and small catchment dams can be found in the sections below the water balance.
The volume of water flowing out of the Ovens basin into the Murray River represented 80% of the Ovens basin’s inflows.
Water balance table
The table below shows the total volumes of water available and supplied from water resources in the Ovens basin in 2024-25.
Table 1: Water balance, Ovens basin
Major on-stream storages
Major - greater than 1,000 ML - on-stream storages in the Ovens basin are included in the water balance.
Storage levels
Storage levels were 71% in June 2025.
Higher than the previous year
In June 2024, storages were 62% full.
Table 2: Storage levels, Ovens basin
Inflows
Catchment inflow
Catchment inflow represents the volume of water flowing into the waterways of a basin. It is calculated as the total outflows and change in storage minus the known inflows.
Below average inflows of 659,198 ML were received (39% of the long-term average of 1,703,800 ML), less than the previous year (88% of the long-term average).
Below average inflow
Catchment inflow was 39% of the long-term average of 1,703,800 ML.
Less water received than the previous year
Catchment inflow was less than the previous year (88% of the long-term average).
Wastewater treatment plants
Water treated at wastewater treatment plants can be used to supplement water available in the basin. Water discharged to waterways from treatment plants is included as an inflow to the water balance.
Information on treatment plants is reported in the water supply local reports for the water corporation responsible for managing the plant.
In this basin, wastewater treatment plants are managed by North East Water.
Outflows
Diversions
In 2024-25, 24,974 ML of water was diverted for consumptive uses: town, domestic and stock, irrigation and commercial supply. This was similar to the 26,692 ML diverted in the previous year. While a slight decrease in total consumptive use was reported, licensed diversions from unregulated streams were higher than the previous year. The overall decrease in consumptive use was due to the 2,532 ML decrease in the estimate of small catchment dam use volume.
Small catchment dams
Water harvested, used and lost by small catchment dams (farm dams) is included in the water balance.
Table 3: Small catchment dams, Ovens basin
Entitlements and compliance
Entitlements provide the basis for how water is shared in the basin.
Consumptive diversions under bulk entitlements are assessed against the Murray-Darling basin annual cap target for the Murray-Kiewa-Ovens valley. Details of this assessment are published annually in the MDBA’s cap register and annual water take report.
Since 2019-20, the consumptive diversions are also assessed against the annual permitted takes under the Murray-Darling Basin Plan Sustainable Diversion Limit (SDL) compliance reporting which are annually published in the MDBA’s SDL accounts register of take and the Inspector-General of Water Compliance’s SDL compliance statement.
Entitlement volumes
Rights to water in the Ovens basin are shown in Table 4.
Entitlement volumes represent an indication of a maximum volume of water that can be taken or allocated in any one year depending on the rules of the entitlement. The volume available in a particular year is dependent on the rules for allocating water set out in the entitlement, the seasonal conditions in that year and how much water was carried over from the previous year, which can vary. The rules for allocating water under an entitlement differ between entitlements and systems. This affects the ability and likelihood of water being taken in a particular year.
Table 4: Annual entitlement volumes at 30 June, Ovens basin
Available water and take under entitlements
Total water available under entitlements represents the volume of water that was available to be taken by entitlement holders in 2024-25. The volume includes carryover from the previous year, seasonal allocations and net trade into the basin.
Water available under entitlements
100% of entitlement volume was available to high-reliability water share holders for the whole of 2024-25, the same as the previous year.
Water taken under entitlements
There was 20,925 ML taken under entitlements in 2024-25, similar to the previous year (21,015 ML).
Seasonal allocations
- High-reliability entitlement allocations opened the water year at 100% (the same as the previous year).
- There are no low-reliability water shares in the Ovens system, however spill entitlement was available for use during the year.
Restrictions on licensed diversions from streams
- There was a peak of 12 streams with bans on licensed diversions from February to March 2025, compared to no restrictions on streams in the previous year.
- All other streams were unrestricted during the year.
Available water and take table
This table shows the volume of available water and the volume taken under entitlements in 2024-25. Water taken under entitlements could be used for a variety of uses.
More information on available water and take has been detailed in How we account for surface
In 2024-25, a similar amount of water was taken under entitlements to the previous year.
Table 5: Available water and take under entitlements, Ovens basin
Compliance
Compliance against water entitlements is reported for this basin in 3 areas:
- entitlement issued: that the volume of entitlements issued in a basin does not exceed formal caps, and has not increased without appropriate approvals
- water taken: that the volume of water taken during the year does not exceed the volume considered to be available for consumptive and/or in-stream use during that year
- bulk entitlement provisions: that holders of entitlements do not breach any provisions that are documented in their bulk entitlement orders.
Key points on compliance against entitlements in 2024-25
Total entitlement volume
There was no net increase in the total entitlement volume from the previous year.
Total volume diverted
The total volume diverted under entitlements (20,925 ML) was within the volume available for the year (64,714 ML).
Individual bulk entitlements
No individual bulk entitlement holder took more than the annual volume made available to them.
Exceptions to compliance
Individual bulk entitlement holders complied with all provisions in their entitlements except one. See note below.
Note to exceptions to compliance:
- North East Water (NEW) reported that extraction at Bright exceeded the 870 ML Bright bulk entitlement by 2.5 ML (0.3%). A metering discrepancy was identified in June 2025 between the expected extraction volume and the actual volume extracted. Raw water extraction was ceased as soon as the discrepancy was noticed. NEW worked with DEECA and Goulburn-Murray Water following the non-compliance, with 3.0 ML of allocation transferred from the Myrtleford bulk entitlement to the Bright bulk entitlement.
Water for the environment
Environmental watering sites
Environmental watering sites in the Ovens basin that depend on water for the environment include:
- the lower Ovens River (which contains heritage and iconic reaches), which is an important environmental asset that depends on water in the Ovens basin
- the lower Ovens wetlands including Mullinmur Wetland, which support freshwater catfish, egrets, herons, cormorants, bitterns and treecreepers and a large variety of aquatic vegetation
- the Buffalo River and King River, which are important sites for large fish species during their breeding cycle: trout cod are found as far up the King River as Whitfield
- water from the Ovens basin also flows into the Murray basin, helping to maintain environmental assets in that basin.
Environmental water reserve
In 2024-25, water for the environment in the Ovens basin comprised:
- water set aside for the environment and other downstream uses:
- through the operation of passing flows conditions on consumptive bulk entitlements held by Goulburn-Murray Water in the regulated rivers
- through the operation of passing flow conditions on licensed diversions, including those set out in the Upper Ovens River Water Supply Protection Area Water Management Plan
- through flow-sharing arrangements set out in North East Water’s bulk entitlements in the unregulated rivers
- 123 ML of high-reliability water shares held for the environment
- 95 ML of water allocation donated to the Victorian Environmental Water Holder (VEWH) for delivery in the Ovens system, which included 39 ML of water allocation transferred to the VEWH
- all other water in the basin not allocated for consumptive uses: this water also provides social, recreational and cultural benefits.
Environmental water use
In 2024-25, 218 ML of environmental water was delivered in-stream in the Ovens basin.
Management responsibilities
Management of water in the Ovens basin is undertaken by various parties
| Authority | Management responsibilities |
|---|---|
| Goulburn-Murray Water |
|
| North East Catchment Management Authority |
|
| North East Water |
|
| Water supply system | 2023-24 (ML) | 2024-25 (ML) |
|---|---|---|
| Beechworth | 565 | 587 |
| Bright system | 867 | 872 |
| Harrietville | 68 | 59 |
| Moyhu | 33 | 36 |
| Myrtleford | 474 | 578 |
| Oxley | 69 | 71 |
| Wangaratta system | 3,217 | 3,186 |