On this page:
About surface water
Surface water is water that occurs or flows on land. It includes water in waterways – rivers, creeks, streams, watercourses or natural channels where water regularly flows – as well as in lakes, reservoirs, dams, wetlands and other water bodies. Water resources explains more about surface water resources.
River basins are the primary reporting unit for surface water information for these Accounts.
This summary reports on statewide surface water availability, use, compliance and trade for 2024-25.
A breakdown of availability, use and compliance in each of the 29 river basins is provided in the surface water local reports.
2024-25 overview
Less water was available
The volume of surface water available in river basins was 40% lower than last year.
More restrictions on licensed diversions
There were more restrictions on licensed diversions from streams than in the previous year.
Lower seasonal allocations
Water availability from seasonal determinations was slightly lower than the previous year.
More consumptive water was used
Around 19% more water was taken for consumptive use than the previous year.
When compared to the previous year, in 2024-25:
- less water (total streamflow) was available (12,160,001 ML, compared to 21,088,949 ML in 2023-24)
- there was less water in storages (71% at the end of June 2025, compared to 87% at the end of June 2024)
- a similarly high allocation was made to high-reliability water shares; however, low-reliability allocations were lower
- there were more restrictions on licensed diversions from streams (a peak of 123 in February 2025, compared to 80 in March 2024)
- no desalinated water was produced (the same as the previous year)
- more surface water was diverted for consumptive uses (3,551,231 ML, compared to 2,986,799 ML in 2023-24)
- a similar volume of water was delivered for environmental purposes (945,835 ML, compared to 933,031 ML in 2023-24)
- a similar volume of trade of allocation occurred, with more trade of water shares, and more net interstate trade.
The pattern of increased water use in a drier year is relatively typical, given that most water use is for agricultural purposes, and when rainfall is low, additional water from rivers and streams (or groundwater) is required. The water entitlement framework has mechanisms to ensure that water use remains within sustainable limits, even in dry years.
Table 1 reports on the total available water, total entitlements and total use (consumptive and environmental). In 2024-25, 4,497,066 ML of surface water was taken for consumptive and environmental purposes in Victoria.
Table 1: Available surface water and use
Water availability
Surface water availability across the state is presented as a report on streamflows and storage levels. Streamflow is equivalent to catchment inflow in the river basin water balances in each of the surface water local reports, and the terms are used interchangeably throughout the Accounts.
Overall, there was less water available in 2024-25 than the previous year:
- 53% of long-term average streamflows (from July 1975 to June 2024) were received in Victoria (compared to 93% in 2023-24).
- Total Victorian storage levels reached a peak of 85% in August 2024, compared to the peak of 95% in October 2023.
For more information on rainfall and water availability, see Year In Water.
Total Victorian streamflows
In 2024-25, the total annual streamflow volume for Victoria was 12,160,001 ML, 53% of the long-term average inflows received from July 1975 to June 2024 (22,767,600 ML). This was a lower volume received than the 21,088,949 ML in 2023-24, which was 93% of the long-term average.
In 2024-25:
- all river basins had lower annual streamflow volumes than the previous year, except the East Gippsland basin
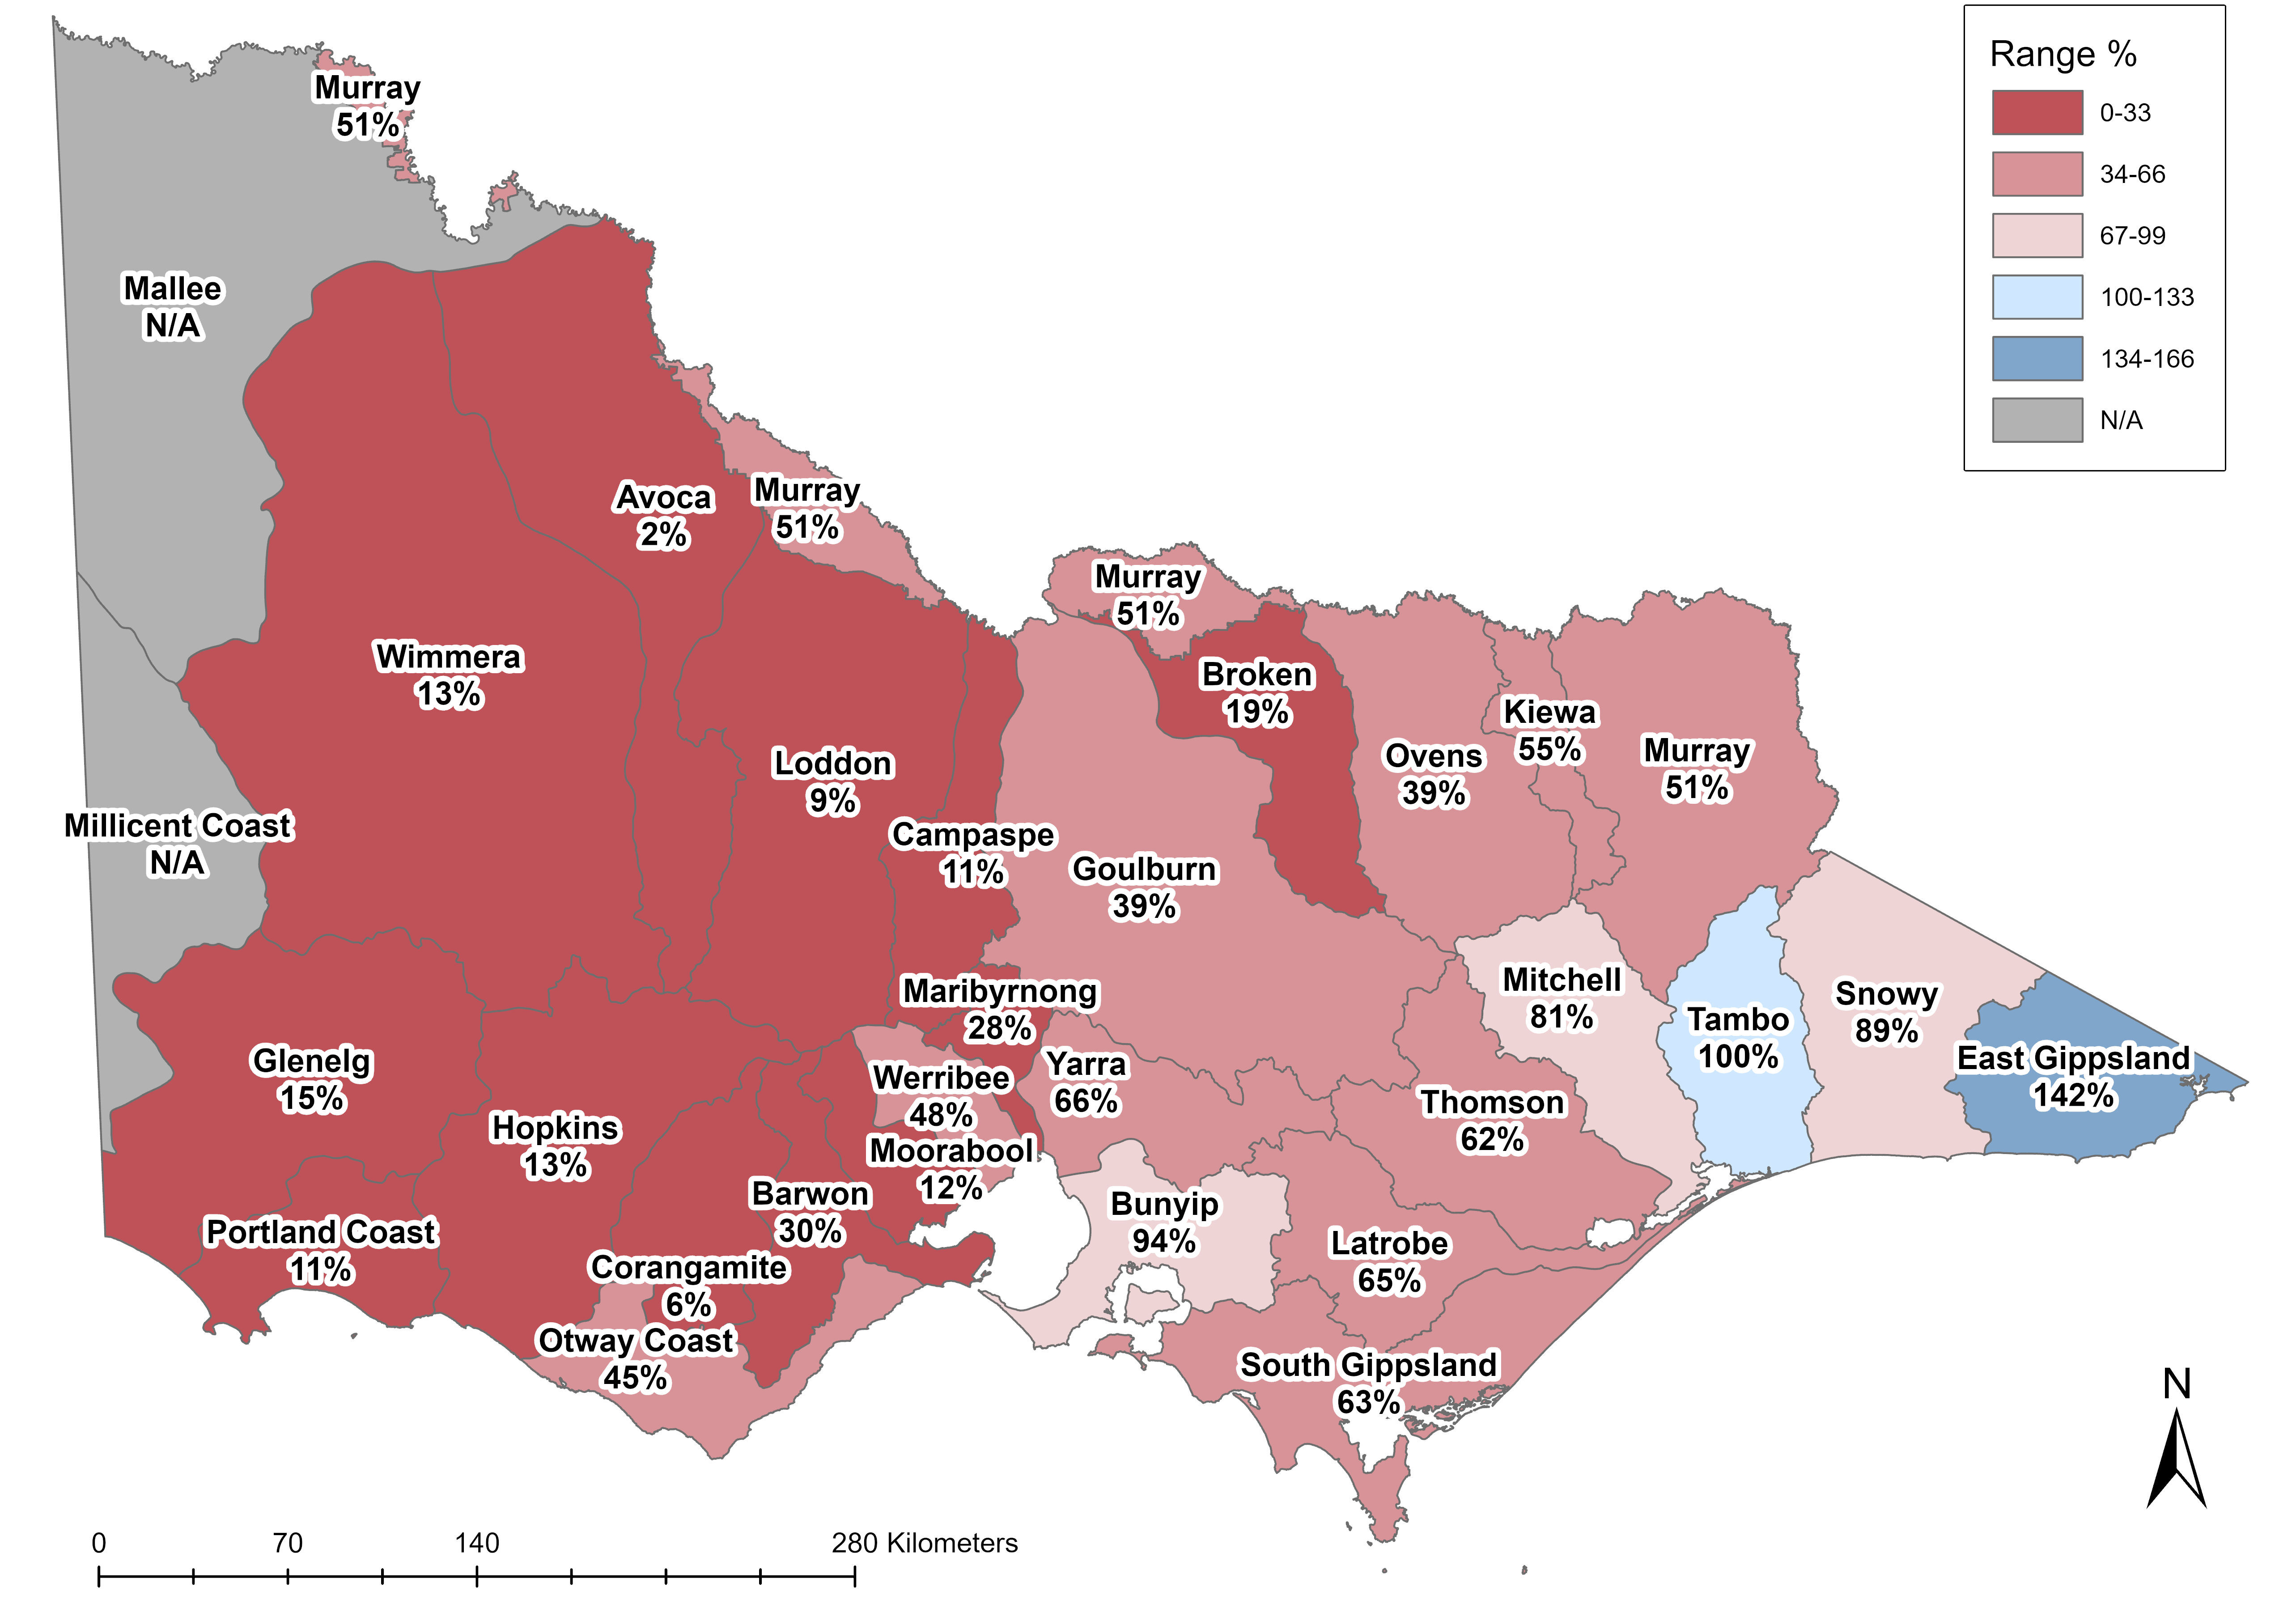
- there was considerable variability in the total streamflow (relative to the long-term average) per basin (Figure 2)
- the Avoca basin received the lowest streamflow compared to the average, receiving 2% of the long-term average volume
- the East Gippsland basin received the highest streamflows compared to the average: 1,260,795 ML, equivalent to 142% of the long-term average volume (similar to the previous year).
Table 2: Victorian streamflows
Figure 2: Victorian streamflows received in 2024-25 compared to the July 1975 to June 2024 long-term average
Melbourne system inflows
The annual natural inflows to Melbourne’s harvesting reservoirs can be compared to 2 different baselines: the long-term average (from 1913-14 to 2023-24) of 574,021 ML, and the average of the last 30 years, which is lower at 476,987 ML.
In 2024-25, inflows were 304,821 ML, 64% of the 30-year average. This is less than the volume of inflows received the previous year (507,651 ML, 105% of the 30-year average).
Inflows in 2024-25 were below the long-term average. This is the second time in the past 5 years, but the 22nd time in the past 28 years, that inflows into storages have been below the long-term average.
Storages
Victoria’s major water storages can hold approximately 12,405 GL. Of this, Melbourne’s storage capacity is approximately 1,812 GL, and the capacity of the state’s major regional storages is approximately 10,594 GL. The combined volume of water stored in Victoria's reservoirs varies both within each year and between years.
Total Victorian storage levels started the year at 10,100 GL (82%) and peaked at 85% in August 2024 (compared to 95% in October 2023). Levels finished the year at 7,480 GL (61%) at the end of June 2025.
Total Victorian storages
Victorian major storages were 61% at end June 2025 (compared to 82% at end June 2024).
Melbourne storages
Melbourne storages were 71% at end June 2025 (compared to 87% at end June 2024).
Regional storages
Regional storages were 59% at end June 2025 (compared to 81% at end June 2024).
Regional storage levels
In 2024-25, total regional storage levels:
- started the year at 81% in July 2024
- peaked at 85% in August 2024 (compared to 94% in October 2023)
- finished the year at 59% at end of June 2025.
Melbourne storage levels
In 2024-25, total Melbourne storage levels:
- started the year at 1,568 GL (87%) in July 2024
- reached a peak of 1,632 GL (90%) in October 2024 (compared to 97% in February 2024)
- finished the year at 1,295 GL (71%) at the end of June 2025.
Storages in major urban centres
The total volume of water stored in Victoria’s major reservoirs has historically been at its highest following winter and spring inflows. Storage levels at the end of October are traditionally a good indication of water availability for the remainder of that water year.
Figure 6 presents end-of-October storage levels as a percentage of storage capacity for Melbourne and selected major regional centres from October 2003 to October 2024.
At the end of October 2024, storages were between 61% and 90%:
- The regional storages were all between 61% and 78%, lower than the previous year when regional storages were all between 77% and 98%.
- Melbourne’s combined storage level was 90%, similar to the previous year when it was 96%.
Response to availability
The volume of water available for consumptive and environmental uses will vary from year to year. This section details the management approaches applied in response to availability. The entitlement and planning frameworks include mechanisms to conserve and share water between users in response to seasonal variability and water shortages. The Victorian Desalination Project is a climate independent water source that enables the state to supplement the naturally occurring water supplies when needed.
More information on these mechanisms is available in How is water
With less water available in 2024-25 compared to the previous year, there were more restrictions on licensed diversions from streams and lower seasonal allocations for low reliability entitlement holders. There were 5 towns placed on stage 2 and 3 urban restrictions, compared to none during the previous year.
There were 4 instances of water carting that were required to address isolated water shortages in 2024-25 (see Statewide water supply).
More stream restrictions
There were more stream sections with bans or restrictions than in the previous year.
Lower seasonal determinations
Water share holders had access to less water in 2024-25 than the previous year.
More towns on urban restrictions
More towns were placed on urban restrictions in 2024-25 (compared to none during the previous year).
Seasonal allocations
In 2024–25, high-reliability allocations in all declared water systems reached 100% by year end, except Bullarook, which reached 19%. Low-reliability allocations were made in the Broken and Werribee and Bacchus Marsh systems (100%), and in the Campaspe (48%), with no low-reliability allocations in other systems.
For non-declared systems, the Wimmera Mallee Pipeline product started the year at 61% allocation and ended at 87%, while Coliban Rural licences were allocated 100% at the start of the season.
Table 3: Seasonal water allocations in regulated water systems
Stream diversion restrictions
There were more stream sections with restrictions on licensed diversions in 2024-25 (Figure 7).
- The number of stream sections under restrictions and bans reached a peak of 123 in February 2025, compared to 80 in March 2024.
- There were 78 stream sections on restrictions at the end of 2024-25, compared to 59 at the end of 2023-24.
Desalinated water
Water produced by the Victorian Desalination Project is transferred into Cardinia Reservoir and combined with water sourced from upstream catchments and reservoirs, including O’Shannassy, Upper Yarra, Thomson and Maroondah Reservoirs. The Victorian Desalination Plant can deliver up to 150 GL of water a year when operating at capacity.
No desalinated water was produced (0 GL) for 2024-25, the same as for 2023-24. With storages at 91% in April 2024, the Minister for Water announced that there would be no Desalinated Water required to be produced during 2024-25.
Water use
In Victoria, water can be taken from reservoirs, waterways and aquifers under entitlements issued and authorised under the Water Act 1989.
In addition to formally issued entitlements, the Act enables individuals to take water for domestic and stock use without a licence (for example, from a small catchment dam).
The volume of water taken presented in this overview and in the river basin local reports is reported as the volume of water diverted from a water source. It is the bulk volume of water extracted from the waterways, less any volume returned. Therefore, it includes volumes lost (e.g. to evaporation or seepage) from storages, channels or water supply systems after it is taken from the source.
More information about the water entitlement and planning frameworks is provided in How is water managed?
Use by type
Table 4 shows the use of water in each basin. In some cases, these volumes differ slightly from the volumes of water taken under entitlements in each basin in Table 6. See the method tab of Table 6 for more information.
In 2024-25, 4,497,066 ML of surface water was taken for consumptive and non-consumptive purposes (15% more than the 3,919,830 ML taken in 2023-24).
Of this, 3,557,818 ML was taken for consumptive uses, more than the 2,986,799 ML taken in 2023-24. This includes water used for:
- irrigation: 2,789,112 ML (62% of total use)
- urban: 650,660 ML (14% of total use)
- small catchment dams: 60,901 ML (1% of total use)
- power generation: 50,558 ML (1% of total use).
In addition to the consumptive use, 945,835 ML was delivered for the environment under entitlements (21% of total use). This includes both in-stream and off-stream deliveries. There was an additional 2,712 ML of managed passing flows delivered in 2024-25. The volume of water delivered for the environment was similar to the 951,397 ML delivered in the previous year (933,031 ML under entitlements and 18,366 ML through managed passing flow deliveries).
Table 4: Surface water use by type
Entitlements and compliance
Entitlement volumes
Entitlements provide the basis for how water is shared. The total volume of entitlements changes slightly each year as new entitlements are issued or existing entitlements are modified.
All basins in the state have a cap, which limits the volume of water that can be allocated. In catchments that have reached the cap and allocated all available water within the limit, no new entitlements are created and so there is no net increase in entitlement volume. This cap and trade system means that the only way for a water user to get more entitlement is to purchase it from someone selling unwanted or unused entitlement. The exception to this is when water savings are made, where new entitlement volume may be issued equivalent to the long-term volume of recovered water with no net increase in long-term diversions.
Most basins in Victoria have reached their cap, and so only a minor change in the total statewide volume of entitlements on issue is likely to occur annually.
Here is the list of Bulk and Environmental Entitlement as at 30 June 2025. Visit the Water Register for up-to-date information on bulk entitlements.
In 2024-25, there was a net decrease in total entitlement volume of around 60 GL from 2023-24 (Table 5 and Figure 10). Most of this volume (45 GL) reflects a decrease in small catchment dam entitlement volume, which is represented by the estimated volume of use from small catchment dams for the water year. This approach is taken because not all small catchment dams are required to be licensed or registered under the Water Act 1989. The remaining net 15 GL decrease reflects smaller allowed entitlement volume changes in individual basins.
New bulk entitlements and bulk entitlement amendments
In 2024-25, 4 new entitlements were created.
Of these, 3 were created in the Latrobe basin by transferring 16 GL from the Latrobe 3-4 Bench Bulk Entitlement to 3 new entitlements with equal shares of 5,333 ML:
- Latrobe GLaWAC Bulk Entitlement, which is held by Southern Rural Water (SRW) on behalf of the Gunaikurnai Land and Waters Aboriginal Corporation (GLaWAC).
- Latrobe – Southern Rural Water licences bulk entitlement for use by irrigators on the Latrobe River.
- Latrobe System Environmental Entitlement 2025 held by the Victorian Environmental Water Holder.
These entitlements came into effect on 27 March 2025. No water was used under these entitlements in 2024-25.
A new environmental entitlement for the Thomson/Macalister system was also created from water savings to mitigate the impact of the Macalister Irrigation District 2030 (MID2030) irrigation modernisation project on local sites of high environmental value. This provides 1,569 ML of high-reliability and 692 ML of low-reliability entitlement to the VEWH. An amendment was also required to SRW’s Thomson/Macalister System bulk entitlement to reflect the new obligation to supply water to this environmental entitlement.
Amendments were also made to 13 Bulk Entitlements via minor notices to make necessary changes to storage manager appointments, and to remove redundant references to resource managers.
All changes to bulk entitlements are administered under Part 4, division 1 of the Act and require consultation and consideration of matters including the impact on current users and the environment.
Table 5: Entitlement volumes by owner type
Water available under entitlements
Table 6 represents the total volume of water that was available, and taken, under entitlements in each basin in 2024-25. The volumes of water taken for each basin may differ from Table 4, where the volumes represent the use of water in each basin. See the Method tab of Table 6 for more detail.
The total available water volume in Table 6 is the sum of: opening carryover, allocation issued and the net trade of water (trade in less trade out), less water lost to spill. Rules for carryover, allocation and trade vary between entitlements and systems, and not all concepts are relevant for each basin.
Table 6 shows that in 2024-25:
- there was 6,961,431 ML of water available under entitlements (similar to the 7,161,007 ML available in 2023-24)
- there was 4,466,981 ML of water taken under entitlements (more than the 3,864,056 ML taken in 2023-24).
Table 6: Water available and taken under entitlements
Compliance
Compliance against water entitlements is reported in these Accounts in 3 areas:
- entitlement issued: that the volume of entitlements issued in a basin does not exceed formal caps or has not increased without appropriate approvals
- water taken: that the volume of water taken during the year does not exceed the volume considered to be available for consumptive and/or in-stream use during that year
- bulk entitlement provisions: that holders of bulk entitlements do not breach any provisions that are documented in their bulk entitlement orders.
Key points on compliance against entitlements in 2024-25
Total entitlement volume
There was no net increase in the total entitlement volume from the previous year.
Total volume diverted
At a state scale, the total volume diverted under entitlements (4,466,981 ML) was within the volume available for the year (6,961,431 ML).
Individual bulk entitlements
No individual bulk entitlement holder took more than the annual volume made available to them.
Exceptions to compliance
Individual bulk entitlement holders reported 5 instances of failures and difficulties experienced in complying with entitlement provisions. More detail has been provided in the Ovens, Broken, Goulburn, Wimmera and South Gippsland basins.
Water leaving the basin
Water leaving the basin is water that flows out of basins at their downstream ends. This includes all water flowing through the system, excluding diversions and losses. In terms of water for the environment, it includes managed environmental water delivered in-stream, obligations on consumptive entitlements (such as passing flows) and above cap water. This water flowing through the system provides environmental, social, recreational and cultural benefits.
Although water leaving the basin provides environmental benefits, the proportion of flows leaving Victorian river basins is not in itself a reliable indicator of river health. This is due to the complex interaction of ecological processes and the seasonal variability of streamflows.
In 2024-25, at a statewide scale, water leaving river basins was lower than the previous year. A total of 9,919,613 ML left river basins compared to 19,028,210 ML in 2023-24.
As a percentage of statewide total flows in basins, water leaving the basin was similar to the previous year, with 82% reaching basin outlets in 2024-25, compared to 90% the previous year.
Table 7: Water leaving the basin
Trade
Water markets provide water users flexibility in the quantity and timing of their water use. For some parties, water markets are key to their operations and they rely on allocation trade rather than entitlement ownership.
Similar allocation trade
The volume of priced trades in northern Victoria (1,526,564 ML) was similar to the previous year, and the highest on record.
More net interstate trade
There was 128,669 ML of net water trade out of Victoria, compared to 100,961 ML out of Victoria in the previous year (excluding environmental water).
More water share transfer
High and low-reliability water shares totalling 117,584 ML transferred ownership, compared to 101,487 ML in the previous year.
Trade of surface water varies between water systems. For this summary, all trade activity has been grouped into 3 broad regions. Northern Victoria refers to areas managed by Goulburn-Murray Water, Lower Murray Water, and Coliban Water. Southern Victoria refers to areas managed by Southern Rural Water and Melbourne Water. Western Victoria refers to areas managed by Grampians Wimmera Mallee Water.
Note: Groundwater trade is covered in Statewide groundwater.
For further information:
- An introduction to the water trading framework in Victoria can be found in How is water managed?
- Additional information on Victorian water trade can be found on the Water Register .
- Trade of water in Victoria is subject to trade rules and limits. Information on trade rules can be found on the Water Register
Allocation trade
Water allocations can be traded subject to trade
Allocation trade has been broken down into 3 categories:
- Commercial trade indicates water transferred between customers’ water accounts at an agreed price.
- Zero-priced trade indicates a movement of water from one account to another for zero dollars, excluding any trades involving environment water accounts. These trade applications may indicate a trade between accounts owned by the same person or related parties, or a return following carryover parking (an arrangement involving leasing temporary carryover space in a water storage).
- Environmental trade indicates trade between environmental water accounts, or zero-priced trades between private and environment water accounts.
In 2024-25, a total of 4,061,501 ML of allocation was traded in Victoria, similar to the total of 4,177,490 ML traded in 2023-24.
As is usually the case, most allocation trade occurred in northern Victoria (4,040,371 ML), with smaller volumes traded in southern Victoria (19,130 ML) and western Victoria (2,000 ML). In 2024-25, the volume of commercial trades in northern Victoria was the highest on record for the 5th year in a row (1,526,564 ML). This is consistent with the trend of increasing allocation trade since 2007-08.
Environmental water holders use trade to move water across Victoria and between their accounts. Environmental trade made up 34% of the total volume traded in 2024-25, a smaller proportion than the previous year. This includes water that was transferred to South Australia for delivery in the South Australian Murray system.
Table 8: Summary of seasonal allocation trade
Trade in northern Victoria
A total of 2,513,807 ML of zero-priced trade (both non-environment and environmental trades) occurred in northern Victoria in 2024-25. A total of 1,526,564 ML of priced trade (commercial trades) occurred in northern Victoria in 2024-25 (Figure 12).
Trade between VIC, NSW and SA
Water trade between Victoria, New South Wales (NSW) and South Australia (SA) is permitted subject to trading rules. Interstate trade of water can occur due to allocation trade or tagged trade. Tagged trade is when water used in one trading zone is sourced from a different trading zone. Victoria has tended to be a net importer of water over most of the past 2 decades, with exceptions in some years, including when conditions are unusually wet in Victoria or dry in NSW.
In net terms during 2024-25, excluding environmental trade(Figure 13):
- Victoria exported 38,645 ML of water to NSW, compared to 14,094 ML exported in the previous year
- Victoria exported 90,024 ML to SA, compared to 86,867 ML exported in the previous year
- In total, there was 128,669 ML of interstate trade out of Victoria. This was an increase from the net total of 100,961 ML out of Victoria in the previous year.
Water share transfer
Trade of water shares represents a trade of ongoing water entitlements in declared systems, where water rights are disconnected from land ownership. Most of the state’s regulated water systems have been declared.
From 2009-10 to 2011-12, large volumes of water shares were transferred to the Australian Government as part of buyback programs under the Basin Plan, resulting in much higher overall transfer volumes. In July 2024, the Australian Government commenced a new water buyback program under the Basin Plan. More information about this latest round of purchases can be found at Australian Government Water Share Transfers - Water .
In 2024-25, water share transfer across Victoria included (Figure 14 and Table 9):
- 76,106 ML of high-reliability water shares transferring ownership; more than the previous year (67,589 ML).
- 41,478 ML of low-reliability water shares transferring ownership; more than the previous year (33,898 ML).
Table 9: Water share transfers
Most of this trade occurred in northern Victoria, with a smaller amount in southern Victoria. Western Victoria does not have declared systems, so it has no water shares.
Unregulated surface water trade
Outside declared water systems, take and use licences allow water to be taken from either unregulated surface water systems or from groundwater, and to be used subject to the conditions defined in the licence. Take and use licences are tied to a specific property, and must be traded when the property is sold.
Unlike allocation and water share trading, surface water take and use licence trading occurs more evenly across the state, with several trades in the west of the state. Trades as part of land transfers were the most common trade type.
In 2024-25, surface water take and use licence trading resulted in:
- 1,222 ML of unregulated surface water permanently traded (not as part of a land transfer), slightly more than the 958 ML permanently traded in the previous year
- 6,339 ML of unregulated surface water temporarily traded, more than the 4,394 ML temporarily traded in the previous year
- 10,129 ML of unregulated surface water traded as part of a land transfer. This was similar to the 10,620 ML traded as part of a land transfer in the previous year.
Table 10: Trade of surface water take and use licences
Table 10 shows that southern Victoria had the highest volume traded across all trade types, followed by northern Victoria then western Victoria. This broadly aligns with the total volume of surface water take and use licences on issue in each region.
Trade in surface water take and use licences was less than trade in groundwater take and use licences. For information on groundwater trade see the trade section in Statewide groundwater.