On this page:
Message from the Minister

The 2024-25 Victorian Water Accounts tell the story of a very dry year across most of Victoria, with low rainfall and reduced water availability compared to recent years.
Much of western and central Victoria received the lowest annual rainfall (July to June) in 50 years. The volume of water flowing through the Avoca and Loddon river basins for the year was only 2% and 9% of long-term average inflows, respectively. Across the state, the river inflow volume was the driest since 2018-19. For many Victorians, this was the second consecutive very dry year.
The dry conditions led to water resource managers applying some of their tools to ensure that water is shared fairly and sustainably, such as increased restrictions and lower seasonal allocations. As often seen in drier times, overall water use increased (within the available limits) compared to the previous year. Much of this was to support our critical agricultural needs through the low rainfall periods.
Our major water storage levels fell from 82% to 61% over the year, a reduction of 2,620 billion litres or more than 1,600 times the volume of the MCG. While fluctuations in storage volumes between wet and dry years are somewhat normal for Victoria, consecutive very dry years place significant pressure on our water supplies. The likelihood of these conditions is increasing under climate change, and we are planning for it as the new normal.
The Victorian Water Accounts – now in their 22nd year – provide a wealth of information and resources to inform researchers, policymakers, and anyone interested in understanding water availability and use over time across the state.
Through a refreshed partnership with the Geography Teachers’ Association of Victoria, we have developed new curriculum resources for year 7 and 10 students. These bring the Victorian Water Accounts to life for a younger audience through interactive classroom workbooks made available to teachers, as well as a suite of public online water education This work supports students in learning about the importance of sustainably managing our precious water resources, and helps inspire the next generation of water leaders.
THE HON MICHAELA SETTLE
Minister for Water
October 2026
Overview
Drier conditions
Less rainfall was received across the state, with less water flowing down rivers and into storages than the previous year.
Less water was available
The total available volume of surface water, groundwater and recycled water was lower than the previous year.
More stream restrictions
There were more restrictions on licensed diversions from streams than the previous year.
More urban restrictions
There were more towns on staged restrictions than the previous year.
The purpose of the Victorian Water Accounts is to report on water availability and use, and to demonstrate Victoria’s compliance with its water entitlement framework. It covers different sources of water including surface water, groundwater, recycled water and desalinated water.
Table 1 and Figure 1 report the total available water, and the consumptive and environmental entitlements and use across the state for the last 2 years for each of the 4 different sources of water.
Available water in the Accounts includes:
- the total volume of water that flowed down streams
- the sum of available water in a groundwater management unit (the permissible consumptive volume (PCV) or the entitlement volume where there is no PCV)
- the amount of wastewater treated
- the volume of water produced by the Victorian Desalination Plant.
Entitlement volumes are the maximum volumes authorised to be allocated and used by a holder for the year.
Use of surface water and groundwater is the volume of water diverted from a waterway or groundwater bore. Recycled water use is the end use of treated wastewater (e.g. for urban, agricultural or commercial purposes) that did not get discharged to the environment.
In 2024-25:
- 13,675,649 ML of water was available, the lowest since 2018-19 (and less than the 22,613,346 ML available in 2023-24)
- 7,677,063 ML of entitlement was on issue
- more water was used for consumptive and environmental purposes (4,951,659 ML, compared to 4,312,779 ML in 2023-24).
Water availability
- Most of the state’s west and north received less rainfall than during the previous year. Rainfall ranged from the lowest on record in parts of Victoria’s west and centre, and South Gippsland, to above average in parts of Central and East Gippsland.
- Less water was available than the previous year (13,675,649 ML in 2024-25, compared to 22,613,346 ML in 2023-24).
Rainfall
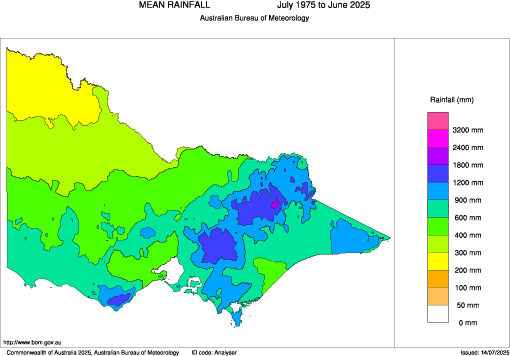
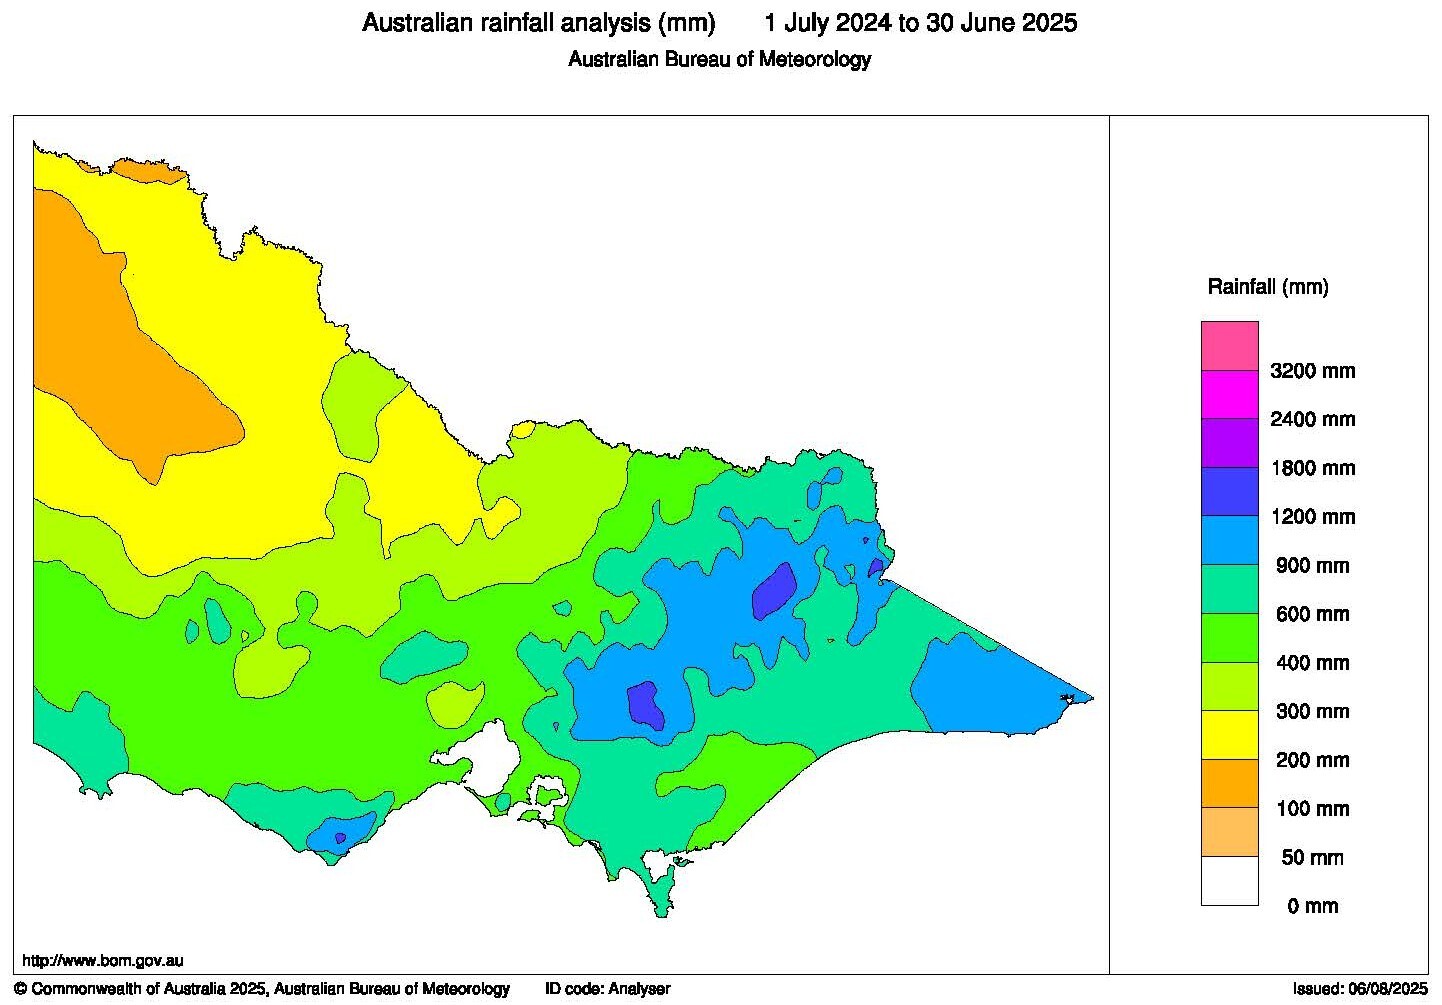
Long-term average rainfall in Victoria (July 1975 to June 2025 - Figure 2a) varies from as low as 200 mm a year in the north-west of the state to up to 2,400 mm a year in parts of the alpine region.
The range for total annual rainfall received in 2024-25 varied across the state from 100 mm to 1,800 mm (Figure 2b). Less rainfall was received across Victoria’s north and west, and parts of the south-east, and more rain was received in parts of the south-west.
- The lowest rainfall - between 100 mm and 200 mm - was received in the Victoria’s north-west.
- The highest rainfall – between 1,200 mm and 1,800 mm - was received in parts of the Yarra Ranges, the Otway region and alpine region.
When compared to the 1975 to 2025 reference period, the rainfall received in 2024-25 ranged from the lowest on record in parts of Victoria’s west and centre and South Gippsland, to above average in parts of Central and East Gippsland (Figure 3). Close to average rainfall was received over most of eastern Gippsland, in isolated parts of the state’s north, and around Geelong.
Figure 3: Rainfall deciles 2024-25
Sourced from the Australian Bureau of Meteorology
The various layers on Figure 4 show the seasonal pattern of rainfall during the year, relative to the 1975-2025 reference period.
- Winter rainfall ranged from below to very much below average over most of Victoria’s western and central regions, but was above average across part of eastern Gippsland, and ranging.
- Spring rainfall was above average over parts of Victoria’s north, and a mix of close to or below average conditions for most of the state.
- Summer rainfall was below to very much below average over the state’s central and western regions, largely close to average over Victoria’s eastern and southern regions, and above to very much above average over most of eastern Gippsland.
- Autumn rainfall was average to very much above average across eastern Victoria, and below to very much below average across western and central Victoria, with lowest on record rainfall in parts of the state’s south.
Figure 4: Seasonal rainfall deciles 2024-25
Sourced from the Australian Bureau of Meteorology
Total water available
Overall, the total available volume of Victoria’s surface water, groundwater, desalinated water and recycled water in 2024-25 was 13,675,649 ML (Figure 5 and Table 2), less than the amount available in the previous year (22,613,346 ML). Compared to 2023-24:
- Less surface water was available.
- A similar amount of groundwater and recycled water was available.
- No desalinated water was produced, the same as the previous year.
Table 2: Total available water
Response to water availability
The amount of water available for consumptive and environmental uses varies from year to year. The entitlement and planning frameworks include mechanisms to conserve and share water between users in response to seasonal variability and water shortages. More information on these mechanisms is provided in How is water managed?
In 2024-25:
- seasonal allocations were slightly lower than the previous year (see Statewide surface water)
- there were more restrictions on licensed diversions from streams (see Statewide surface water)
- there were 3 groundwater management units that were subject to restrictions (the same number as the previous year) (see Statewide groundwater)
- there were 8 towns placed on urban restrictions (stages 2 and 3), compared to none during the previous year Statewide water supply)
- water carting was required on four occasions to address isolated water shortages (see Statewide water supply)
- there were no temporary qualifications of rights to water.
Water use
Water for all types of uses in Victoria is sourced from reservoirs, waterways and aquifers under entitlements issued and authorised under the Water Act 1989.
Read more about different uses under the entitlement framework in How is water managed?
In 2024-25, 4,951,659 ML of water was used (for consumptive and environmental purposes), more than the previous year (4,312,777 ML) (Figures 6 and 7, and Table 3). This includes surface water, groundwater, recycled water and desalinated water.
- The amount of water used for consumptive purposes was 4,005,823 ML (more than the 3,379,746 ML used in 2023-24).
- The amount of water delivered to the environment was 945,835 ML (similar to the 933,031 ML delivered in 2023-24).
Table 3: Water use by type
Water entitlements
All river basins in the state have a cap on entitlements, and groundwater management units have a permissible consumptive volume (PCV), which limits the volume of water that can be allocated. In areas that have reached the cap or PCV and available water within the limit has been allocated, no new entitlements are created so there is no net increase in entitlement volume. The exception is where water-savings are made, in which case new entitlement volume may be issued equivalent to the long-term volume of recovered water with no net increase in long-term diversions.
Read more about entitlements in How is water managed?
In 2024-25, the reported entitlement volume was slightly lower than the previous year due to some changes to surface water entitlement volumes (Figure 8 and Table 4). The decrease was mainly due to a decrease in estimated water use by small catchment dams, which is reported as entitlement volume in the Accounts, because not all small catchment dams are required to be licensed or registered under the Water Act 1989. Visit Statewide surface water for more information.
Traditional Owner organisations hold surface water and groundwater entitlements. The entitlement volume held by these organisations is included in Table 4 in the consumptive entitlement volume totals. On 30 June 2025, this volume was around 9.8 GL. The organisations represented in this statistic include Registered Aboriginal Parties as well as other known Aboriginal organisations and cooperatives. More detail is provided on Water for Traditional Owners.
Table 4: Water entitlements by type
Evapotranspiration
Evapotranspiration is the sum of all processes by which water moves from the land surface to the atmosphere via evaporation and transpiration. Evapotranspiration amounts vary considerably across Victoria depending on a range of factors including rainfall conditions and land cover.
- Averaged across Victoria as a whole, evapotranspiration in 2024-25 was estimated to be 483 mm.
- This was below the long-term average evapotranspiration (about 14% less than the post-1975 historic climate reference period), and 17% less than the previous reporting period (2023-24).
- When estimated at a basin-scale, evapotranspiration was generally below long-term average conditions, except in the far south-east of the state.
- Read the for more detail on evapotranspiration in 2024-25.
Looking for more information?
The VWA reports on availability and use across surface water, groundwater, water supply and water for the environment. The structure has changed a bit from the Accounts prior to 2021-22. If you would like to find information equivalent to specific sections in our historical PDF report structure - go to our mapping
Statewide summaries
Learn about different aspects of water availability and use across Victoria in 2024-25.
Local reports
Explore the local water reports by surface water, groundwater or water supply.